

Advanced: Add cascading drop-downs
With cascading drop-downs, the option you select in one drop-down narrows the options available for another drop-down. The two filters that these drop-downs are built on must have a logical or defined relationship in the Data Library: for example, Team to Agent.
EXAMPLE You’ve followed the steps in the Basic section and created a drop-down that lets you see average evaluation scores by team. Add a cascading drop-down so that you can see average scores for a single agent on that team.
Step 1: Add filters if necessary
If your report already has all the filters you need, you can skip this section.
For this example to work, we need to add another filter to the Average Evaluation Score report that the Sample Home Page for a QM Supervisor guide helps you build. This filter lets you see scores by agent.
- Click the report (in the Reports list).
- In the Question panel on the right side of the page, under Filters, click [limit].... The Select Filter window opens.
- In the Name column, click Agent.
- In the Field column, click Agent Full Name.
-
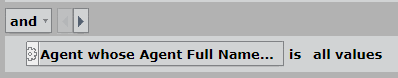
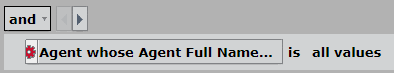
Click Add. The Select Filter window closes, and Agent Name appears as a filter on your report.

Step 2: Name the second filter as a report parameter
Follow Step 1 from the Basic section to name the second filter as a report parameter.
EXAMPLE Give the Agent filter the parameter name “AgentName.”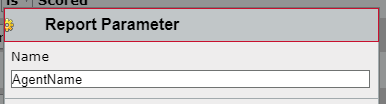
Step 3: Add another drop-down panel to the dashboard
Follow Step 2 from the Basic section to add a second empty panel to the dashboard.
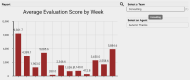
EXAMPLE Add another compact member picker panel and title it “Select an Agent.” Here, you will select agent names after filtering the report by team. Your dashboard now looks like this: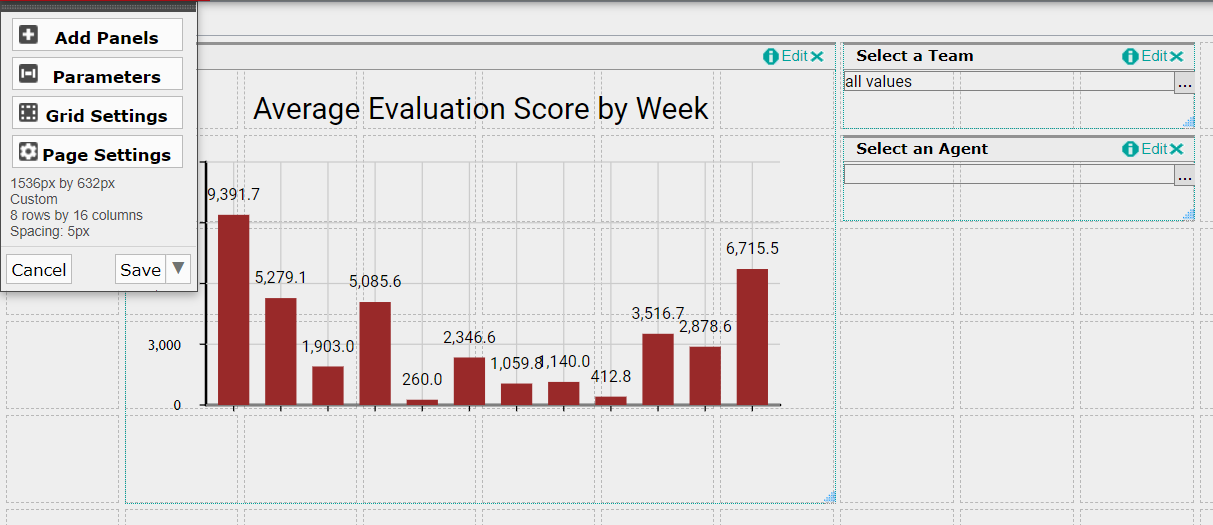
Step 4: Connect the second drop-down to the report and to the first drop-down
This connection tells Data Explorer how the two drop-downs work with each other and with the report.
BEST PRACTICE Before you start this step, make sure you know which drop-down will be first (or the “parent,” the one you’ll use first in the filtering process) and which drop-down will be second (or the “child,” the one you’ll use second).
EXAMPLE You want to filter evaluation scores by team and then by agent. Team is your first drop-down, and agent is your second drop-down.
- Click Parameters (upper left of the screen). The Parameter Bindings window opens, showing the drop-down you connected from the Basic section.
- Click Add a new Parameter (the + icon). Parameter fields appear.
-
(Optional) Enter the name of the second drop-down in the Parameter field.
EXAMPLE As the second step in the filtering process, you will select agent names. Enter “agent” in the Parameter field.
- Make sure that text list is selected from the Type list. (If you’re creating a time-period selector, select time periods.)
- Select the second filter’s name from the Bindings list.
- Click the + icon next to the Bindings list. An additional list appears.
- Select the second drop-down’s title from the list.
- Go back to the first drop-down that you created in the Basic section, and click the + icon next to the second list. A third list appears.
-
Select ‘filter’ on “[the second drop-down’s title]” from the third list. This step connects the first and second drop-downs to each other.
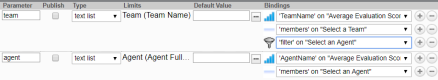
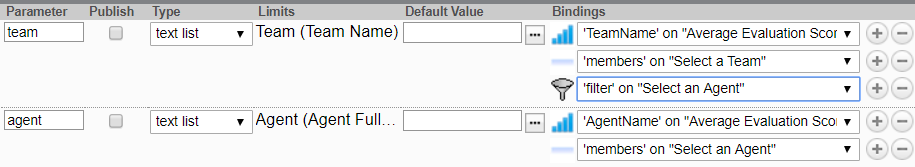
EXAMPLE Our parameter bindings now look like this:
-
Click Apply. The Parameter Bindings window closes.
NOTE If you open the Parameter Bindings window again, the parameters will switch order, with agent on top of team. Don’t worry, they still work the way they did before.
-
Click Save. Congratulations, you’ve added cascading drop-downs to your report!
EXAMPLEOur dashboard now looks like this, with average evaluation scores visible by team and then by agent. Select a team, and then select one or more agents to see scores for those agents.

Use Member Pickers with additional properties
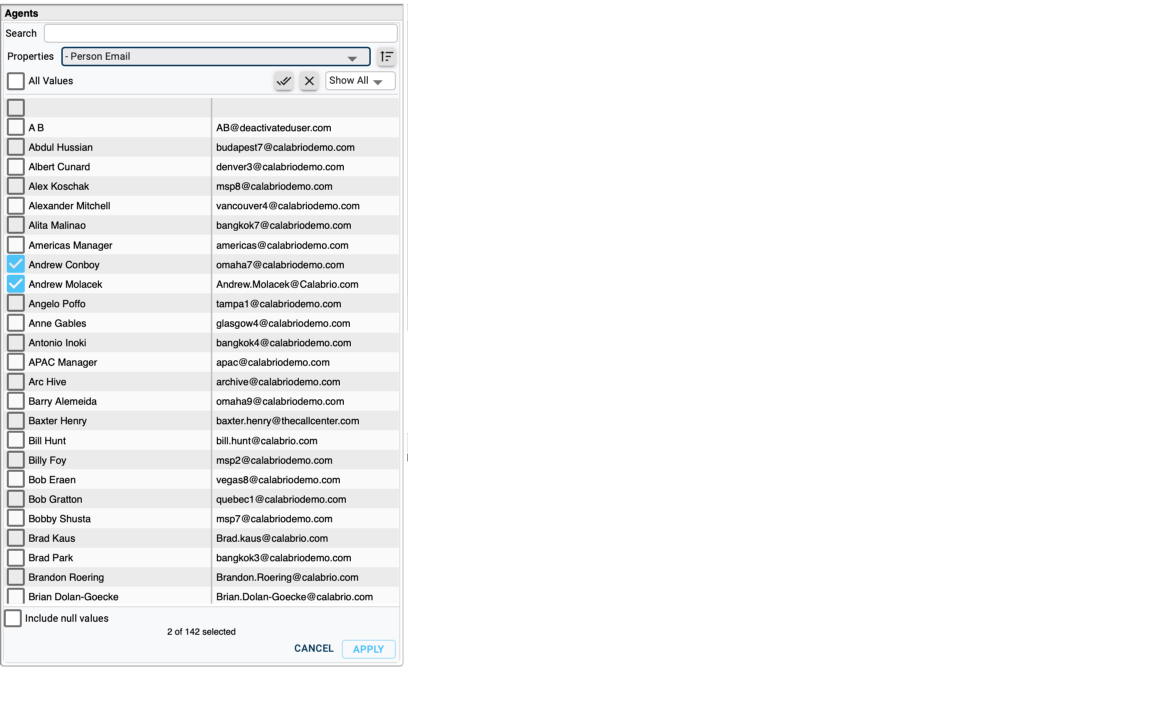
The Properties drop-down list is shown only for the member pickers that are bound to a Subject type parameter that has additional properties defined in the data library. You can use the properties to include additional information that will help with the filter selection.
In the member picker panel, select an additional property, such as Person Email, from the Properties drop-down list to display the property as a new column in the member picker item list.
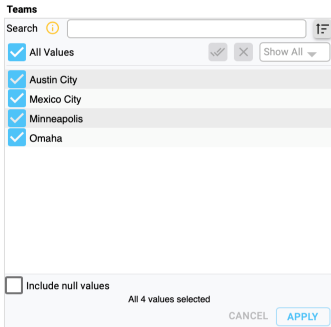
Use All Values SETTING
When you narrow the filter down to the values level, the system will default to selecting all available values, as indicated by the selected All Values check box. This default selection will include all existing values and any new data that is added to the library in the future. You can also select specific values, if necessary.
For example, to create a report that includes three products produced by your company, clear the All values check box and select each product individually. If a new product is added to the data library in the future, your report will not include this new product because you selected only three products and excluded all other values. If you want the new product to appear in your next report, you must select the All values check box.
Keep learning about Data Explorer
Our Data Explorer library has a great collection of guides for people who are new to Data Explorer or are looking to grow their skills. Check them out!
For beginners
- Beginner’s Guide to Data Explorer Dashboards—An intro to the basics of dashboards
- Beginner’s Guide to Data Explorer Reports—An intro to the basics of reports
For QM
- Data Explorer Quick Start Guide: Build a QM Evaluation Report—Step-by-step guide to building a report on evaluation scores
- Data Explorer Quick Start Guide: Monitor Today’s Contact Volumes and Recordings—Build reports that help you keep track of contacts coming in today
- Data Explorer Quick Start Guide: Build a Report on Call Recording Events—Step-by-step guide to building a report on hold, pause, silence, and talk over events
For Analytics
- Data Explorer Quick Start Guide: Build a Report on Phrase Hits—Create a report on hits from a specific phrase category for the past six months
- Data Explorer Quick Start Guide: Build a Report on Analytics Phrase Hits by Agent—Create a report on phrase hits from the past week, broken down by agent
For intermediate users
- Data Explorer Quick Start Guide: Filter Reports on Your Dashboard—Reduce the list of reports you need to wade through by adding interactive filters
- Data Explorer Quick Start Guide: Customize a Report’s Appearance—Make your reports more useful by changing how they look
- Data Explorer Quick Start Guide: Create a Drill-Through Dashboard—Start with the big picture and dig into the details