

Data Explorer Quick Start Guide: Build a QM Evaluation Report
In this guide, we show you how to build a report that shows you question-level evaluation scores, including which answer the evaluator selected and a direct link to the contact, organized by agent and evaluation—all in one place. This report helps you efficiently prepare for agent coaching sessions.
If you haven’t worked with Data Explorer very much, don’t worry. We explain every step. But if you’re completely new to Data Explorer, you might want to start with the Beginner’s Guide to Data Explorer Dashboards.
The information in this guide also applies to Data Management.
Video Overview: Watch Me Build | QM Evaluation Report (length 21:53)
Step 1: Build the basic report
NOTE If your system has a very high number of evaluations, Calabrio ONE might run a little slowly during this step. If that bothers you, skip to Step 2: Filter the data and come back to Step 1 when you’re done.
Add the Question Score measure
The first step in building any report is selecting the data you want to see.
- Click Data Explorer in the top menu.
- Click New Report (upper left corner of the page). The blank report page appears.
- Click [measure]. The Select Measure window opens.
- Select Question Score.
-
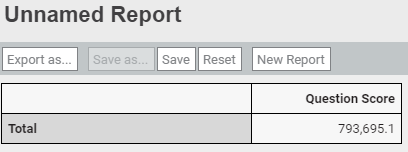
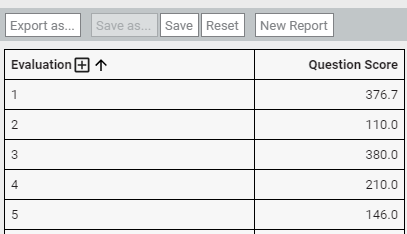
Click Add. The Measure: Question Score window closes, and the basic report appears. At this point, it looks like this:
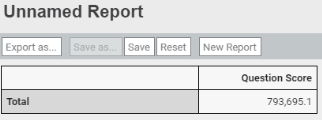
This is the total number of points earned in all the evaluations that have been completed in Calabrio ONE for your organization. This isn’t a very helpful number, but things will start to make more sense in the next step.
Group the question score data
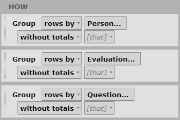
In this step, we sort scores into meaningful buckets.
- Click [grouping]. The Select Grouping window opens.
- Select Evaluation.
-
Click Add. The Grouping: Evaluation window closes, and the report now looks like this. We’ve shown only the first few rows here; you probably have many more.
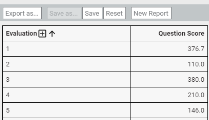
This grouping separates the total number of points by evaluation. Each row is a separate evaluation. Let’s keep going to separate these scores by question.
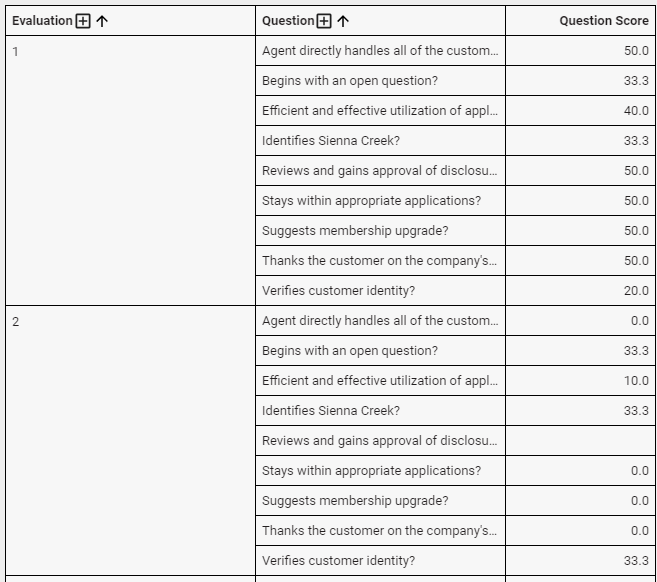
- Click [grouping].
- Select Question.
-
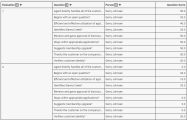
Click Add. The report now looks like this.
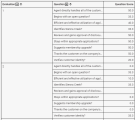
This grouping shows the score for each individual question. Now we’re getting somewhere! Now let’s see the agent for each evaluation.
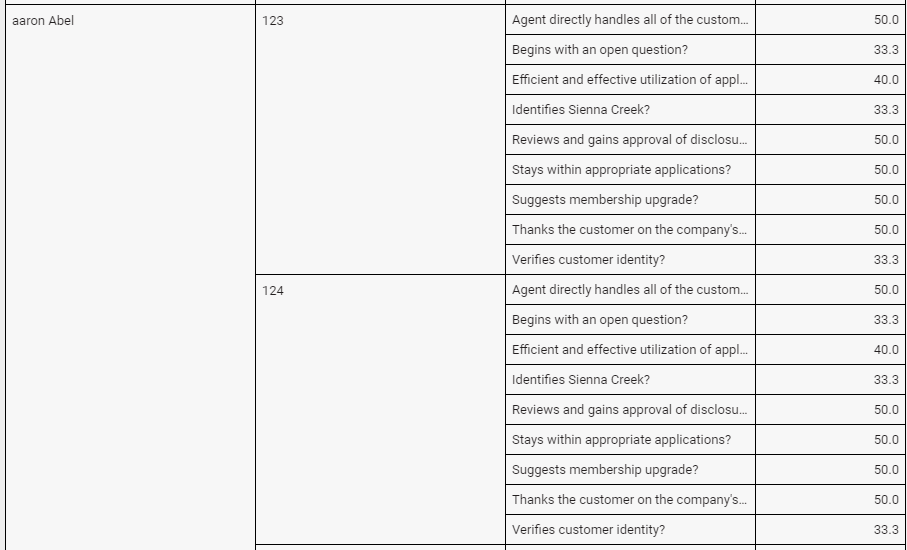
- Click [grouping].
-
Select Person.
NOTE The Agent grouping is also an option, but Agent is a WFM concept. When you’re building a QM report, use the Person grouping.
-
Click Add. Here’s what we get:
Now we can see which agent each evaluation is for, but we don’t need to see the same person’s name over and over again. Let’s fix that.
-
Drag the Person grouping and drop it above Evaluation.
Here’s how the report looks now. The agents’ names are in alphabetical order.
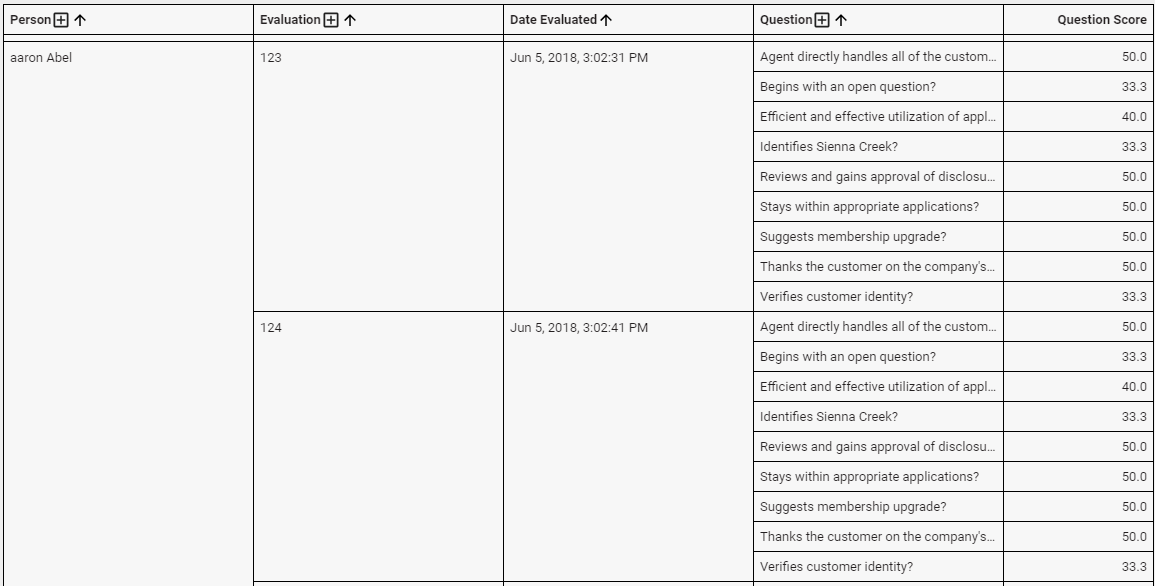
Now, let’s group these evaluation scores by date and time.
- Click [grouping].
- Click Time (upper right corner of the Select Grouping window).
-
Select Date Evaluated.
NOTE Just like its name says, this grouping organizes scores by when the contact was evaluated. To group by when the contact happened, select Contact Start Time instead.
- In the Period panel on the right side of the window, select Date Evaluated.
-
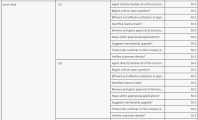
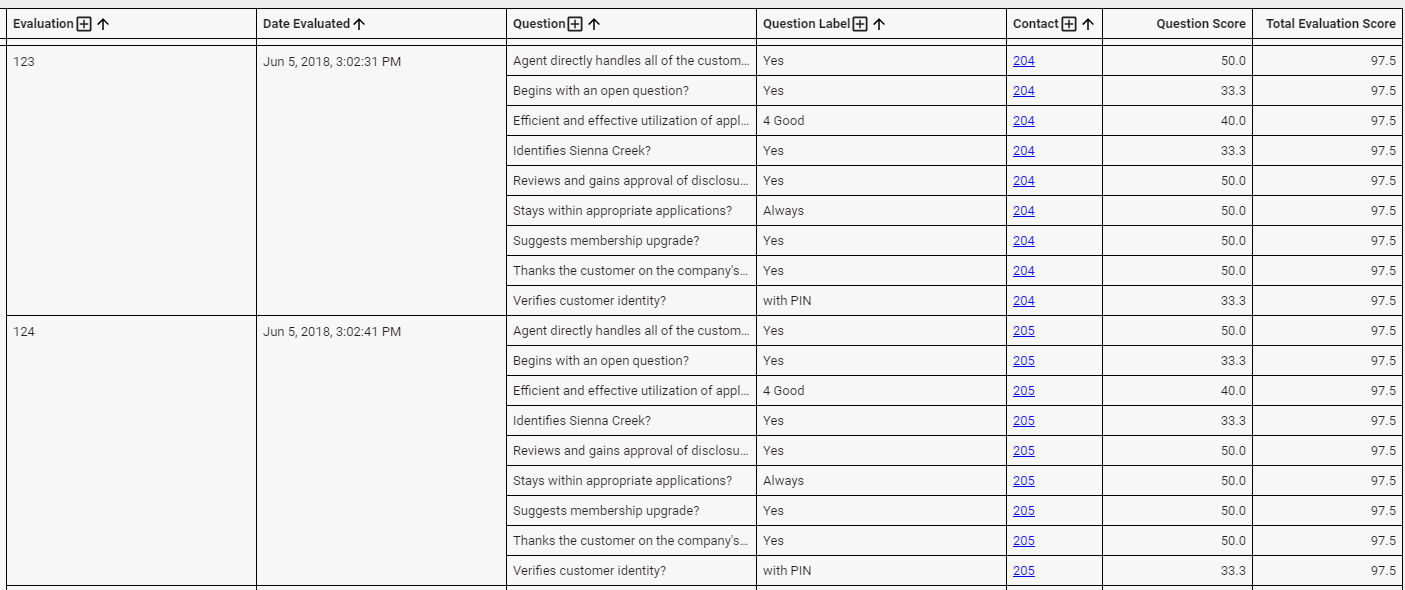
Click Add. The report now looks like this:
Similar to when we grouped by Person earlier, we see the same date listed over and over. Let’s fix that.
-
Drag the Date Evaluated grouping and drop it between Evaluation and Question. That’s better:

Let’s keep going and add the answer for each evaluation question to our report.
- Click [grouping].
- Select Question Label.
-
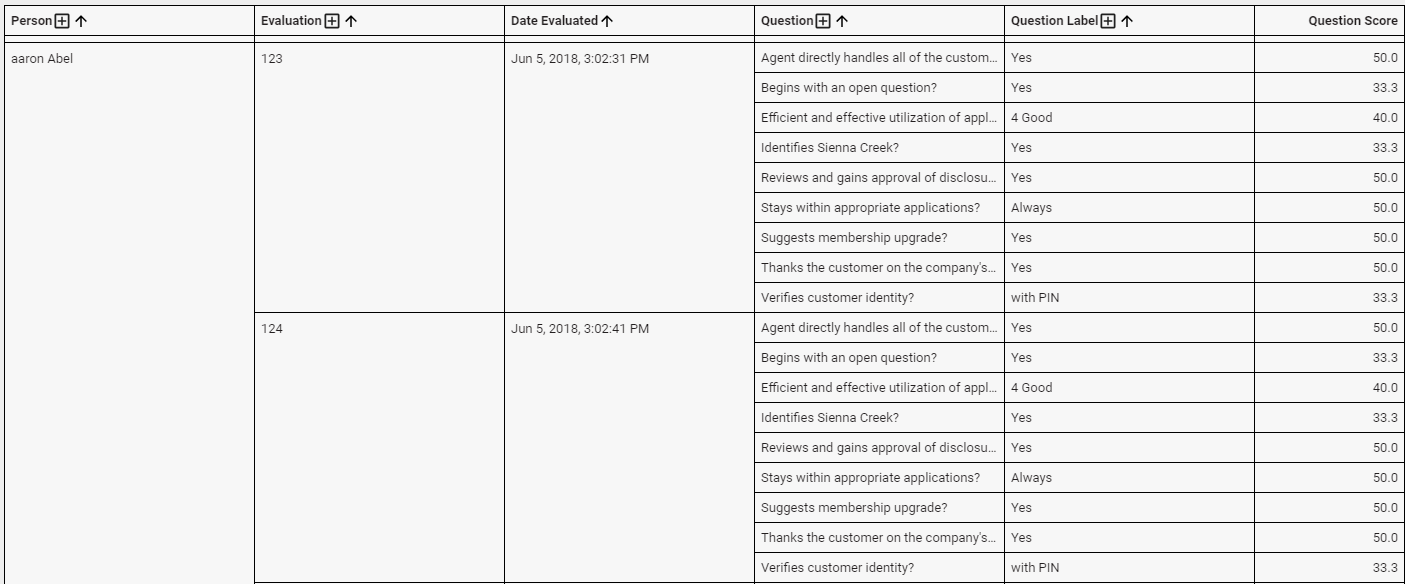
Click Add. Here’s what we have now:


Add the Total Evaluation Score measure
Up until now, we’ve been working with just one measure: Question Score. Let’s add another measure: a column that shows the total score for each evaluation.
- Click [measure].
- Select Total Evaluation Score.
- Select #,###.0 from the Format drop-down list.
-
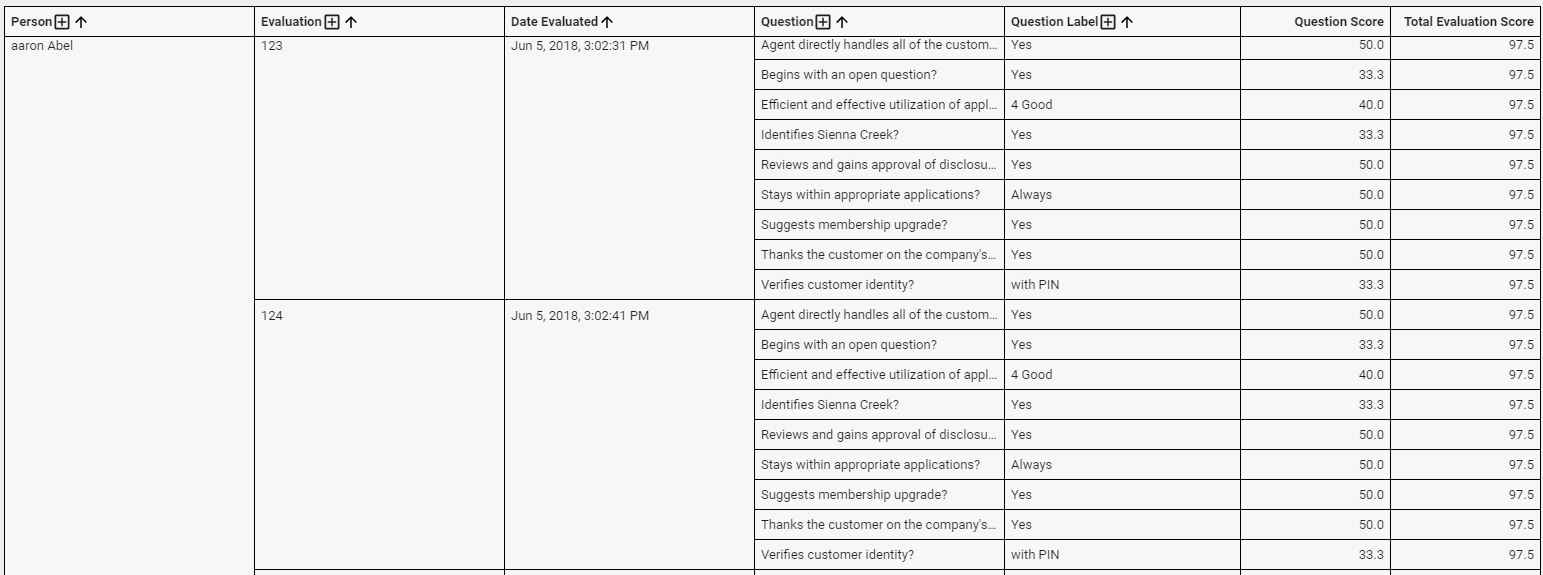
Click Add. Here’s the result:
Add a link to each contact
This link takes you straight to the contact if you see something in the report that needs further investigation.
- Click [grouping].
- Select Contact.
-
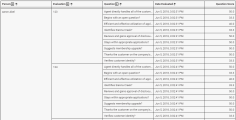
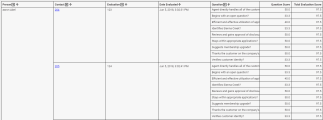
Click Add. The report now looks like this. Depending on the size of your monitor, you might need to scroll sideways to see this new column. You can click on the contact ID to open the contact on the Interactions page. Pretty neat, huh?
Let’s rearrange things so that we don’t see the contact link repeated over and over.
-
Drag the Contact grouping and drop it between Person and Evaluation. That’s better. (On our monitor, this layout covers the Question Label column. Scroll sideways to see any hidden columns.)

Step 2: Filter the data
We’ve built the report, but it’s just too much data. Let’s add filters to narrow things down to evaluations during the last month for one specific team.
Filter by date
In this step, we limit the evaluations to only those that were completed today and within the last 30 days.
- Click [limit]. The Select Filter window opens.
- Click Time .
-
Select Date Evaluated.
NOTE Just like its name says, this filter shows you contacts based on when they were evaluated. To see contacts based on when they happened, select Contact Start Time instead.
- In the Period panel, select Date Evaluated.
-
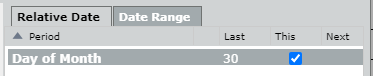
Click Add Filter (the + icon). The Select Period window opens.
- Select Day of Month.
- Click OK. The Select Period window closes.
- Enter 30 in the Last column.
-
Select This.
- Click Add. The Filter: Date Evaluated window closes.

Filter by team
In this step, we limit the evaluations to only those for agents on a specific team.
- Click [limit].
- Select Team.
- In the Field panel, select Team Name. Team names appear in the right panel.
- Clear the All values check box.
- Select the team whose evaluations you want to see.
- Click Add.
NOTE If you would like to see scores from all teams but see only one team’s score at a time on your dashboard, see the Data Explorer Quick Start Guide: Filter Reports on Your Dashboard
Filter out irrelevant evaluations
Data Explorer automatically includes information about all evaluations, including some that you might not want to report on. In this step, we limit our report to only show evaluations that have been scored (as opposed to being in some other state, like Needs Approval) and to remove evaluations that are part of calibration exercises.
- Click [limit].
- Select Contact Evaluation State.
- In the Field panel, select Contact Evaluation State.
- Clear the All values check box.
- Select Scored.
- Click Add.
- Click [limit].
- Select Evaluation.
- In the Field panel, select Score Is Counted.
- Clear the All values check box.
- Select 1.
- Click Add.
- Click [limit].
- Select Evaluation.
- In the Field panel, select Evaluation IsDeleted.
- Clear the All values check box.
- Select 0.
- Click Add.
That’s it! The report is finished. Congratulations!
Step 3: Save the report
- Click Save (upper left corner of the page). The Save Report window opens.
- Enter a name for the report.
- Click Save. The Save Report window closes, and the report name appears in the upper left corner of the page.
Step 4: Share the report
This step is optional, but sharing reports helps you easily communicate the report’s information to other people, like direct reports or upper management. Anyone you share a report with will see only the data they have permission to see, so you don’t need to worry about exposing information to the wrong people.
- Click Data Explorer in the top menu.
- (Optional) Select Owned by Me from the drop-down list at the top left of the page.
- Right-click the report and select Share from the drop-down list. The Sharing window opens.
-
Select the level of control to give the people you are sharing with.
Permission What it means None
No one else can see the report.
View
Other people can see the report but can’t copy it or make any changes to it.
Explore
Other people can adjust the groups and filters in the report but can’t save changes.
Save As
Other people can save their own copy of the report and edit their copy. This is the most commonly used option.
Edit
Other people can edit your original report.
- Click OK. The Sharing window closes.
Congratulations, you’ve built a Data Explorer report!
Keep learning about Data Explorer
Our Data Explorer library has a great collection of guides for people who are new to Data Explorer or are looking to grow their skills. Check them out!
For beginners
- Beginner’s Guide to Data Explorer Dashboards—An intro to the basics of dashboards
- Beginner’s Guide to Data Explorer Reports—An intro to the basics of reports
For QM
- Data Explorer Quick Start Guide: Build a QM Evaluation Report—Step-by-step guide to building a report on evaluation scores
- Data Explorer Quick Start Guide: Monitor Today’s Contact Volumes and Recordings—Build reports that help you keep track of contacts coming in today
- Data Explorer Quick Start Guide: Build a Report on Call Recording Events—Step-by-step guide to building a report on hold, pause, silence, and talk over events
For Analytics
- Data Explorer Quick Start Guide: Build a Report on Phrase Hits—Create a report on hits from a specific phrase category for the past six months
- Data Explorer Quick Start Guide: Build a Report on Analytics Phrase Hits by Agent—Create a report on phrase hits from the past week, broken down by agent
For intermediate users
- Data Explorer Quick Start Guide: Filter Reports on Your Dashboard—Reduce the list of reports you need to wade through by adding interactive filters
- Data Explorer Quick Start Guide: Customize a Report’s Appearance—Make your reports more useful by changing how they look
- Data Explorer Quick Start Guide: Create a Drill-Through Dashboard—Start with the big picture and dig into the details