

Data Explorer Quick Start Guide: Create a Drill-Through Dashboard
The information in this guide also applies to Data Management.
FAQs
What is a drill-through dashboard?
A drill-through dashboard is a series of dashboards with related information layered on top of each other. They allow you to click on a broader category in an upper dashboard and view more detailed information on that category in a lower dashboard.
EXAMPLE You’re using Calabrio Analytics to monitor the use of phrases in calls. You can layer dashboards to drill down from phrase categories to phrases.
Why would I want to make a drill-through dashboard?
Drill-through dashboards let you dig deeper into information to help you more directly see the connections between information that appears on different dashboards. You can always create reports and compare them side by side in a dashboard, but drill-through dashboards give you a different way to view and analyze information.
Instructions
EXAMPLE We will link a Top Phrase Categories dashboard to a Top Phrases in Category dashboard, allowing you to drill down from phrase categories to individual phrases in each category.
Prerequisites
Before creating your drill-through dashboard, do these steps:
-
Decide which dashboards you want to link and how you want to link between them. Which dashboard will be at the upper level, and which will be at the lower level? How do you want to drill down from the upper dashboard to the lower dashboard?
EXAMPLE In a Top Phrase Categories dashboard (the upper dashboard), you want to click a category and drill down to the Top Phrases in Category dashboard (the lower dashboard) with information about the phrases in that category.
-
Decide how you want to filter the data.
EXAMPLE You want to filter a Top Phrase Categories dashboard by group, team, and dates.
- Create all the reports you want to connect across the layers of your drill-through dashboard. These reports must contain any filters that you want to apply across the drill-through layers.
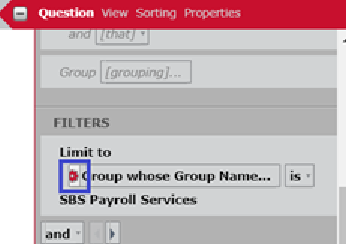
Step 1: Set report filters as parameters
The element on the upper dashboard that you want to click to drill down to the lower dashboard must be both a filter and a parameter.
EXAMPLE Of all the filters in your report, you only want to control the filters for groups, teams, and dates on your dashboards. Follow the steps below to set these filters as report parameters.
-
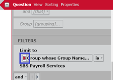
Open the report, and click the cog icon next to the filter. The Report Parameter dialog box opens.
-
Enter a parameter name in the Name field.
NOTE You will use this name to identify your filter later, so give the parameter a name that you will easily remember.
- Click Save. The Report Parameter dialog box closes.
- Repeat steps 1-3 until you are finished setting parameters for all the reports you want to link.
Step 2: Link parameters to reports
-
Create a new dashboard, place the upper report on it, and configure the dashboard parameters.
NOTE See the Calabrio ONE User Guide for how to create dashboards, place reports on them, and configure parameters.
-
Enter the parameter name in the Name field.
NOTE You will need to enter this exact name later, so give the parameter a name that you will easily remember.
- Check the Publish box.
- Repeat steps 1-3 for the lower dashboard.
Step 3: Link the dashboards to each other
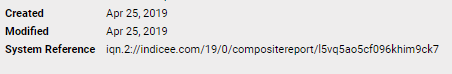
- Right-click on your lower dashboard (not the report), and select Get Info from the drop-down list. The Dashboard Info dialog box displays.
-
Copy the string of letters and numbers after the last slash (/) in the System Reference field.
NOTE You might need to expand the dialog box to see the whole number.
EXAMPLE In the picture below, this string of letters and numbers is “l5vq5ao5cf096khim9ck7.”
- Click OK. The Dashboard Info dialog box closes.
- Open your upper report (not the dashboard).
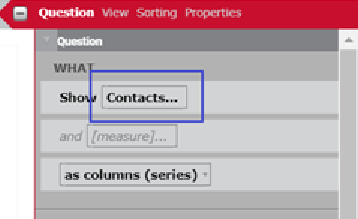
-
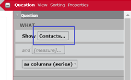
Under the WHAT section, click the measure that you want use to drill down to the lower dashboard. The Measure window displays.
- Enter LINK "#home/mystuff/dashboard?ct=Document&cid=[asset[ in the Content Attributes field.
-
Copy the string of letters and numbers from step 3 at the end of the text you just entered followed by two closing brackets.
EXAMPLE LINK "#home/mystuff/dashboard?ct=Document&cid=[asset[l5vq5ao5cf096khim9ck7]]
-
After the closing brackets, enter the name of a parameter that you want to connect down to your lower dashboard using the format in the example below.
EXAMPLE The parameters that we want to connect are named UpperGroups on the upper dashboard and LowerGroups on the lower dashboard. Use your exact parameter names in place of UpperGroups and LowerGroups.
LINK "#home/mystuff/dashboard?ct=Document&cid=[asset[l5vq5ao5cf096khim9ck7]]&prm.LowerGroups=[param[UpperGroups]] -
Repeat step 9 until you have added all the parameters that you want to link.
EXAMPLE When we add links to parameters for dates and teams, our string looks like this:
LINK "#home/mystuff/dashboard?ct=Document&cid=[asset[l5vq5ao5cf096khim9ck7]]&prm.LowerGroups=[param[UpperGroups]]&prm.LowerDates=[param[UpperDates]]&prm.LowerTeams=[param[UpperTeams]] -
Enter the name of the lower-level parameter that you want to drill down to using the format in the example below.
EXAMPLE When we click a category in our Top Phrase Categories dashboard, we want to drill down to phrases associated with that Category. Use your parameter name in place of Category. Note the quotation marks at the end to close the string.
LINK "#home/mystuff/dashboard?ct=Document&cid=[asset[l5vq5ao5cf096khim9ck7]]&prm.Groups=[param[Groups]]&prm.Dates=[param[Dates]]&prm.Teams=[param[Teams]]&prm.Category=[dataitem[group]]” - Click Apply. The Measure window closes.

To check that the drill-through dashboard is working correctly, go to the upper dashboard and click the category you want to drill down to. The lower report should display.
Troubleshooting
If your drill-through dashboard is not working, check that all these parts of your formula are correct:
- Brackets and parentheses
- Parameter names
- The identifier for the lower dashboard
Keep learning about Data Explorer
Our Data Explorer library has a great collection of guides for people who are new to Data Explorer or are looking to grow their skills. Check them out!
For beginners
- Beginner’s Guide to Data Explorer Dashboards—An intro to the basics of dashboards
- Beginner’s Guide to Data Explorer Reports—An intro to the basics of reports
For QM
- Data Explorer Quick Start Guide: Build a QM Evaluation Report—Step-by-step guide to building a report on evaluation scores
- Data Explorer Quick Start Guide: Monitor Today’s Contact Volumes and Recordings—Build reports that help you keep track of contacts coming in today
- Data Explorer Quick Start Guide: Build a Report on Call Recording Events—Step-by-step guide to building a report on hold, pause, silence, and talk over events
For Analytics
- Data Explorer Quick Start Guide: Build a Report on Phrase Hits—Create a report on hits from a specific phrase category for the past six months
- Data Explorer Quick Start Guide: Build a Report on Analytics Phrase Hits by Agent—Create a report on phrase hits from the past week, broken down by agent
For intermediate users
- Data Explorer Quick Start Guide: Filter Reports on Your Dashboard—Reduce the list of reports you need to wade through by adding interactive filters
- Data Explorer Quick Start Guide: Customize a Report’s Appearance—Make your reports more useful by changing how they look
- Data Explorer Quick Start Guide: Create a Drill-Through Dashboard—Start with the big picture and dig into the details