

Data Explorer Quick Start Guide: Customize a Report’s Appearance
Make your Data Explorer or Data Management reports more useful by changing how they look.
Before we get started, here’s a quick vocabulary lesson.
| Term | What it means |
|---|---|
|
Measure |
A number that goes into a report—for example, the number of contacts handled or a daily adherence percentage. Most reports are composed of several different measures. |
|
Value |
A single piece of information in a measure. For example, if the measure is the number of contacts handled, a value might be the number of contacts handled by a specific agent. If you’re familiar with Excel, think of a value as a single cell in a spreadsheet. Some of the customizations you can make affect how values look or how you can interact with them. |
|
Content attribute |
Content attributes control what the information in a measure looks like. When you change a content attribute, you change the measure’s appearance. |
Some of the customizations you can make are static (don’t change), and others are conditional, meaning they change their appearance based on specific conditions. In this guide, we’ll start with basic static customizations and work our way up to advanced conditional customizations.
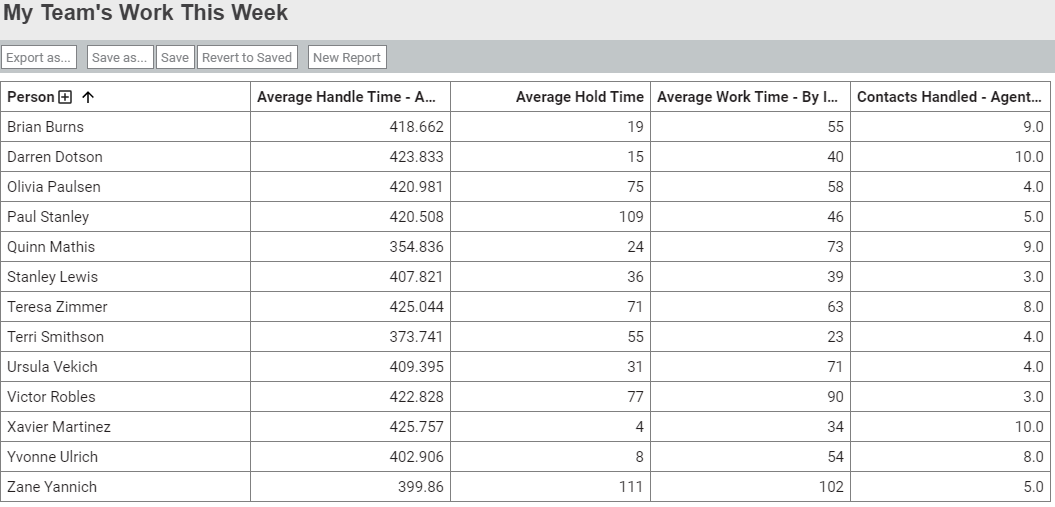
Here’s our starting point, a basic report with no customizations.
- Basic: Change the text in a heading
- Basic: Add a note
- Basic: Add a link to values
- Basic: Show numbers as minutes and seconds
- Intermediate: Change the text color for high or low numbers
- Intermediate: Make multiple customizations to a measure's appearance
- Advanced: Add an up- or down-pointing arrow to show change over time