

Data Explorer Quick Start Guide: Build a Report on Call Recording Events
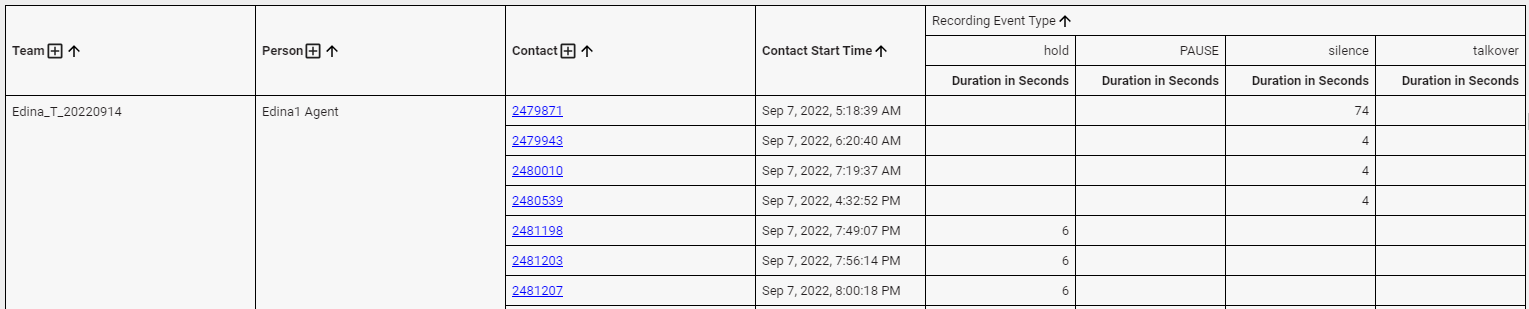
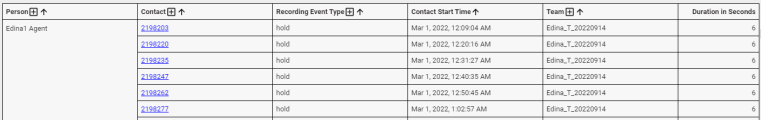
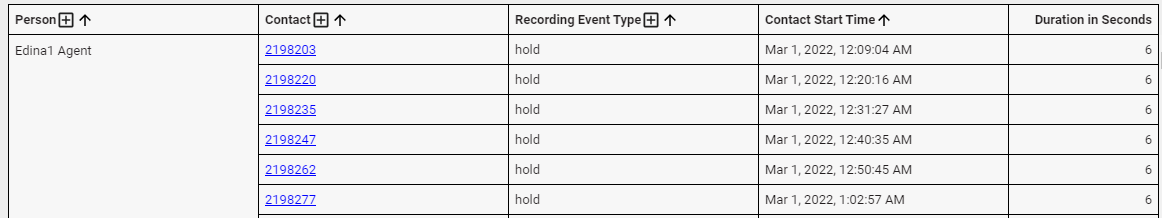
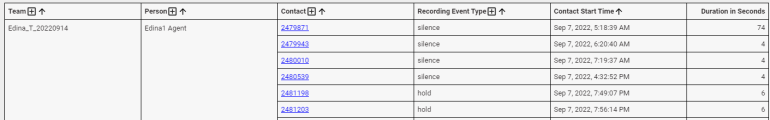
In this guide, we help you build a report that shows you the number of call events (hold, pause, silence, and talk over) for the past week, broken down by team and agent. We’ll also include links to each contact that had one of these events so that you can play it to see what actually happened on the call. Here’s what the final report will look like. (Imagine that this preview has rows with additional teams and agents.)
Here’s a quick review of the different kinds of call events:
| Call Event | Definition |
|---|---|
| Hold | The agent placed the call on hold. |
| Pause | The recording of the call was paused, either manually by the agent or automatically by Calabrio ONE. For example, the agent clicked on a credit card field to enter a customer’s card number, and Calabrio ONE paused the recording to protect the customer’s information. |
| Silence | Neither the agent nor the customer was speaking. Your organization sets the number of seconds of silence that must pass to qualify as a silence event. |
| Talk Over | Both the agent and the customer were speaking at the same time. Your organization sets the number of seconds of talk over that must happen to qualify as a talk over event. |
If you haven’t worked with Data Explorer very much, don’t worry. We explain every step. But if you’re completely new to Data Explorer, you might want to start with the Beginner’s Guide to Data Explorer Dashboards.
The information in this guide also applies to Data Management.
Video Overview: Watch Me Build | A Call Recording Events Report in Data Explorer (length 14:55)
Step 1: Build the basic report
NOTE If your organization has a high number of contacts or you’ve been using Calabrio QM for a long time, Calabrio ONE might run a little slowly during Step 1. If that bothers you, skip to Step 2: Filter the data and come back to Step 1 when you’re done.
Add a custom measure for event duration
The first step in building any report is selecting the data you want to see.
- Click Data Explorer in the top menu.
- Click New Report (upper left corner of the page). The blank report page appears.
- Click [measure]. The Select Measure window opens.
- Click Custom (upper right corner of the window).
-
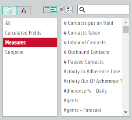
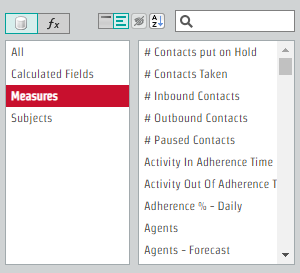
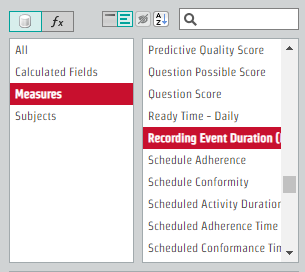
Select Measures from the menu on the left side of the window.
-
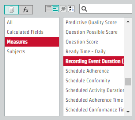
Double-click Recording Event Duration in the list of measures.
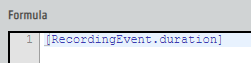
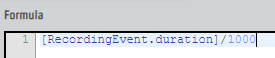
A formula appears in the Formula window.
-
Enter /1000 at the end of the formula.
- Select #,### from the Format: drop-down list.
- Enter Duration in Seconds in the Name field.
-
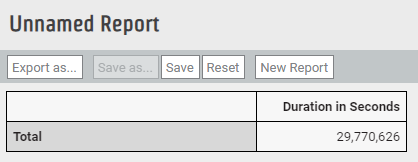
Click Add. The Measure: Duration in Seconds window closes, and the basic report appears. At this point, it looks like this:
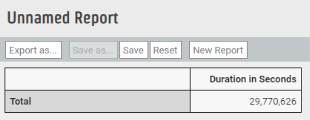
This is the number of seconds for all hold, silence, talkover, and pause events for all calls across your organization—for all time (or at least from when you started using Calabrio ONE). This isn’t a very helpful number, but things will start to make more sense in the next step.


Group the duration data
In this step, we sort this giant number of seconds into meaningful buckets.
- Click [grouping]. The Select Grouping window opens.
- Select Contact.
-
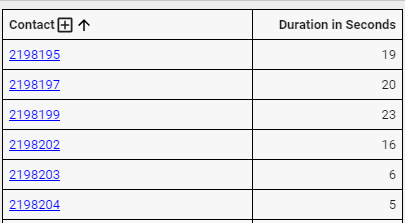
Click Add. The Grouping: Contact window closes, and the report now looks like this.
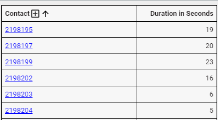
We’ve shown only the first few rows here. You probably have many more. This grouping separates the total event duration in seconds by contact. Let’s keep going to separate these times by event type.
NOTE Each contact number is a link. If you click it, the call recording opens in the media player.
- Click [grouping].
- Select Recording Event Type.
-
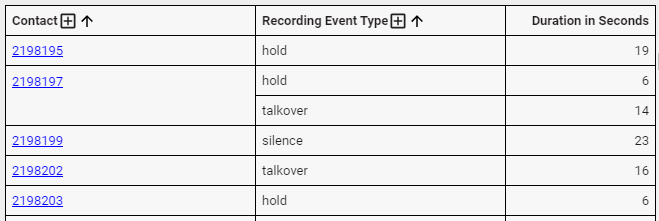
Click Add. The report now looks like this. We’ve shown only the first few rows, but you get the idea.
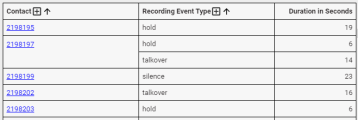
This grouping shows the duration of each type of call event for each call. Now let’s add the agent who handled each call.
- Click [grouping].
- Select Person.
-
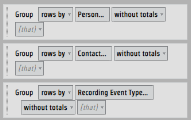
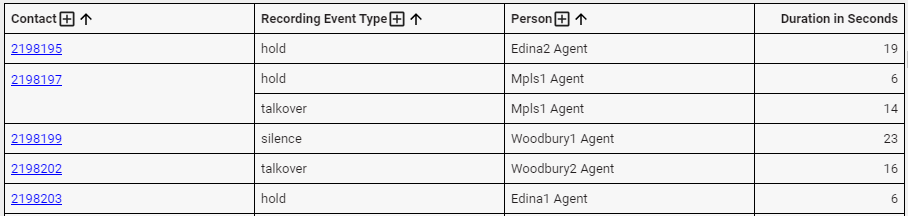
Click Add. Here’s what we get:

Now we can see which agent handled each call, but we don’t need to see the same person’s name repeated. Let’s fix that.
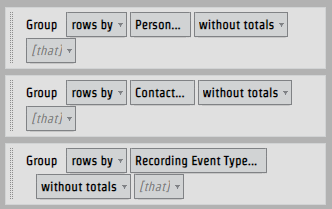
-
Drag the Person grouping and drop it above Contact.
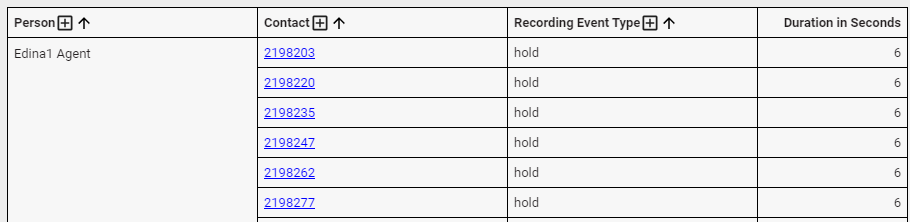
Here’s how the report looks now. The agents’ names are in alphabetical order.

Now, let’s add the date and time for each call.
- Click [grouping].
- Click Time (upper right corner of the window).
- Select Contact Start Time.
- In the Period panel on the right side of the window, select Contact Start Time.
-
Click Add. The report now looks like this:

Let’s keep going and add each agent’s team.
- Click [grouping].
- Select Team.
-
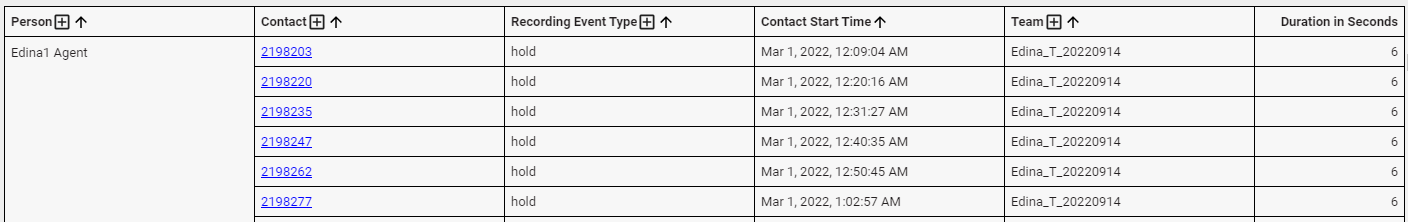
Click Add. Here’s what we have now:
Similar to when we grouped by person earlier, we see the same team name listed over and over. Let’s fix that.
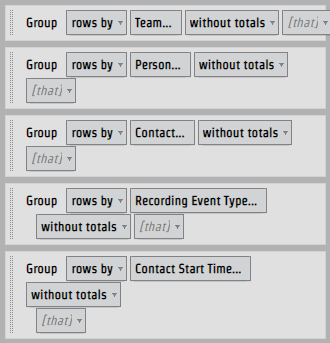
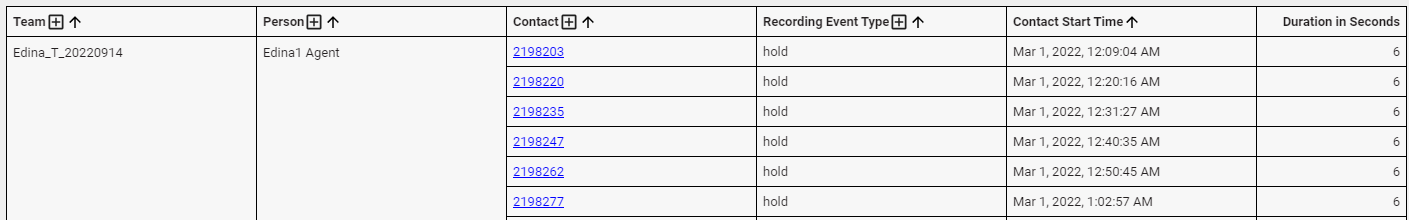
-
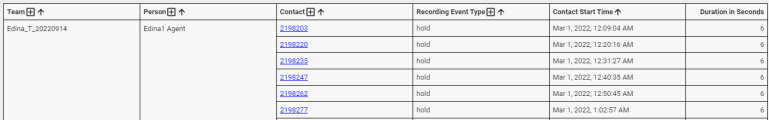
Drag the Team grouping and drop it above Person.
That’s better:
Step 2: Filter the data
We’ve built the report, but it’s just too much data. Let’s filter the data to see only events from contacts that specific teams handled recently.
Filter by date
In this step, we limit the data to only call events that happened today and the previous seven days. This date will be relative, so no matter when you go back to this report, you always see information from today and the previous seven days.
- Click [limit]. The Select Filter window opens.
- Click Time (upper right corner of the window).
- Select Contact Start Time.
- In the Period panel, select Contact Start Time.
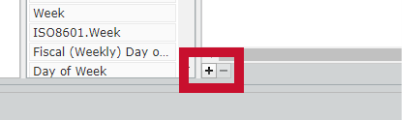
-
Click Add Filter (the + icon). The Select Period window opens.
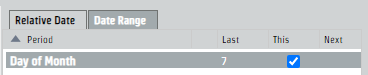
- Select Day of Month.
- Click OK. The Select Period window closes.
- Enter 7 in the Last column.
-
Select This. With Steps 8 and 9, we’re telling Data Explorer to include only data from today and the previous seven days.

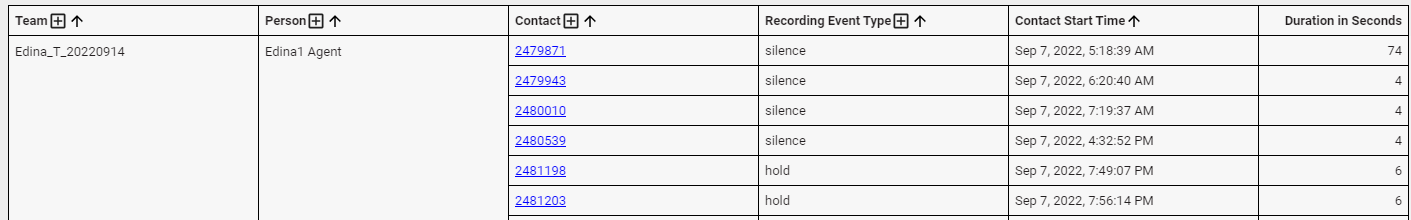
-
Click Add. The Filter: Contact Start Time window closes. Here’s our report, now showing only recording events for the past week:
Filter by team
In this step, we limit the call events to only those from specific teams.
- Click [limit].
- Select Team.
- In the Field panel, select Team Name.
- Clear the All values check box.
- Select the teams whose events you want to view.
- Click Add.
NOTE If you would like to see data from all teams but see only one team at a time on your dashboard, see Data Explorer Quick Start Guide: Filter Reports on Your Dashboard.
Step 3: Create separate columns for each event type
Right now, the Recording Event Type column lists all the event types together. To make things a little easier to read, let’s move the events into separate columns.
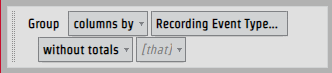
-
For the Recording Event Type grouping, select columns by from the rows by drop-down list.

That’s it! The report is finished. Congratulations!
Step 4: Save the report
- Click Save (upper left corner of the page). The Save Report window opens.
- Enter a name for the report.
- Click Save. The Save Report window closes, and the report name appears in the upper left corner of the page.
Step 5: Share the report
This step is optional, but sharing reports helps you easily communicate the report’s information to other people, like direct reports or upper management. Anyone you share a report with sees only the data they have permission to see, so you don’t need to worry about exposing information to the wrong people.
- Click Data Explorer in the top menu.
- (Optional) Select Owned by Me from the drop-down list at the top left of the page.
- Right-click the report and select Share from the drop-down list. The Sharing window opens.
-
Select the level of control to give the people you are sharing with.
Permission What it means None No one else can see the report. View Other people can see the report but can’t copy it or make any changes to it. Explore Other people can adjust the groups and filters in the report but can’t save changes. Save As Other people can save their own copy of the report and edit their copy. This is the most commonly used option. Edit Other people can edit your original report. - Click OK. The Sharing window closes.
Congratulations, you’ve built and shared a Data Explorer report!
Keep learning about Data Explorer
Our Data Explorer library has a great collection of guides for people who are new to Data Explorer or are looking to grow their skills. Check them out!
For beginners
- Beginner’s Guide to Data Explorer Dashboards—An intro to the basics of dashboards
- Beginner’s Guide to Data Explorer Reports—An intro to the basics of reports
For QM
- Data Explorer Quick Start Guide: Build a QM Evaluation Report—Step-by-step guide to building a report on evaluation scores
- Data Explorer Quick Start Guide: Monitor Today’s Contact Volumes and Recordings—Build reports that help you keep track of contacts coming in today
- Data Explorer Quick Start Guide: Build a Report on Call Recording Events—Step-by-step guide to building a report on hold, pause, silence, and talk over events
For Analytics
- Data Explorer Quick Start Guide: Build a Report on Phrase Hits—Create a report on hits from a specific phrase category for the past six months
- Data Explorer Quick Start Guide: Build a Report on Analytics Phrase Hits by Agent—Create a report on phrase hits from the past week, broken down by agent
For intermediate users
- Data Explorer Quick Start Guide: Filter Reports on Your Dashboard—Reduce the list of reports you need to wade through by adding interactive filters
- Data Explorer Quick Start Guide: Customize a Report’s Appearance—Make your reports more useful by changing how they look
- Data Explorer Quick Start Guide: Create a Drill-Through Dashboard—Start with the big picture and dig into the details