Basic: Add one drop-down to a report
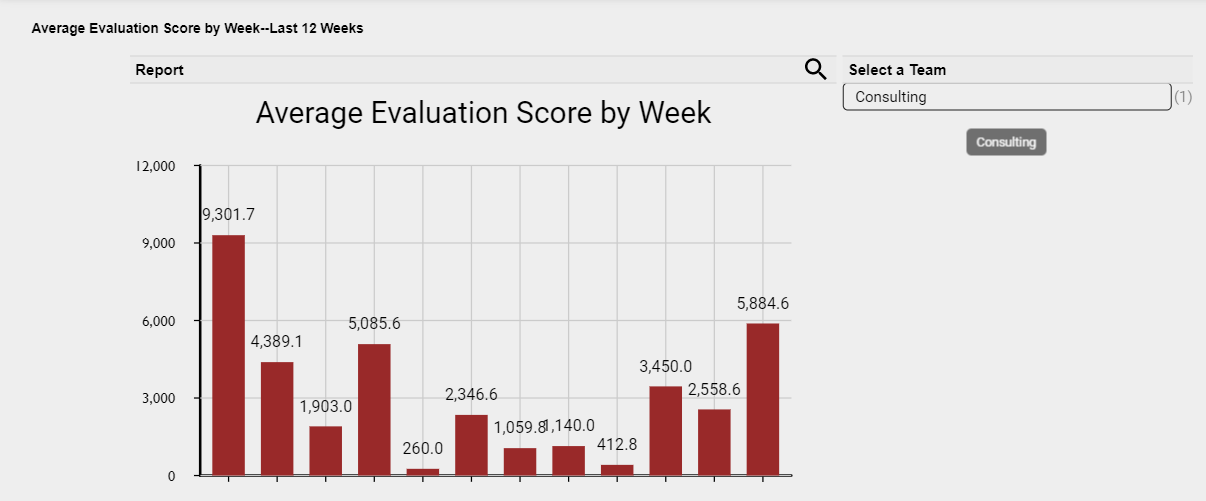
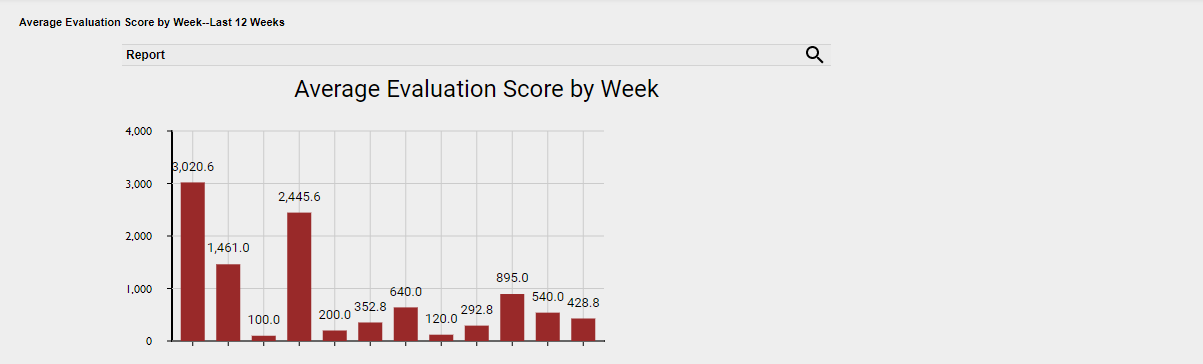
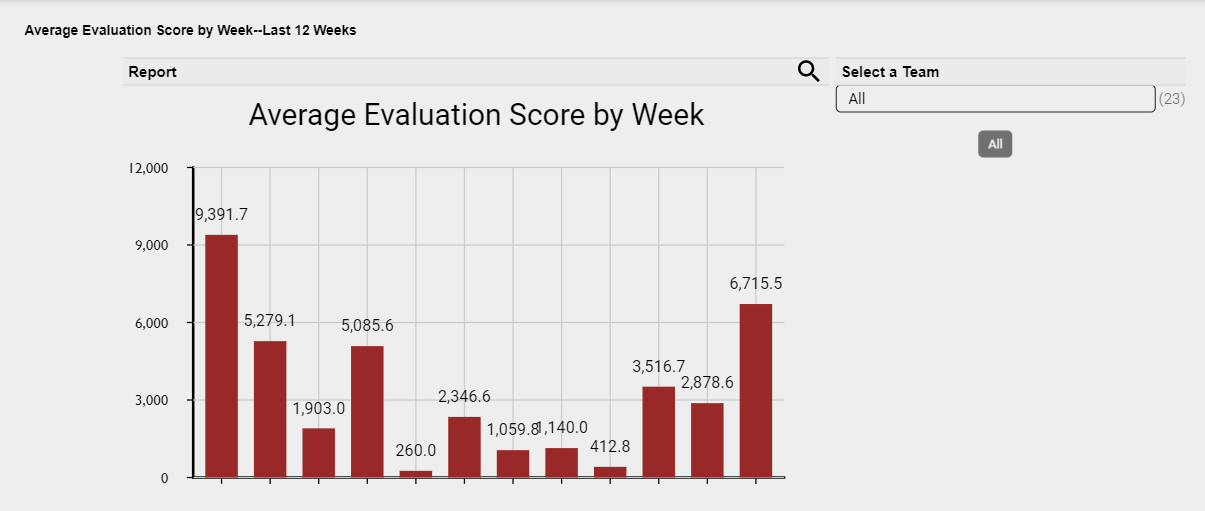
For this guide, we’ll start with the “Average Evaluation Score by Week—Last 12 Weeks” report. You can build this report using the Sample Home Page for a QM Supervisor quick start guide. We’ve created a dashboard and placed the report on it, with plenty of room to add another panel. This report shows you evaluation scores for all your teams lumped together. We’re going to add a drop-down that lets you see scores by team.
Step 1: Name the filter as a report parameter
This step identifies the information that you want to use to narrow down the report. For this example, we will tell Data Explorer that we want to see the Average Evaluation Score report by team.
- Click the report (in the Reports list).
-
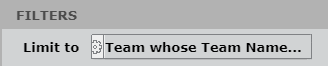
In the Question panel on the right side of the page, under Filters, click the gear icon next to the filter that you want to use to filter the report. The Report Parameter window opens.
EXAMPLE You want to see the Average Evaluation Score report by team. Click the gear icon next to Team whose Team Name...
-
Enter a name into the Name field. Use a name that you will easily remember later. Do not use spaces.
EXAMPLE Enter “TeamName” into the Name field.
-
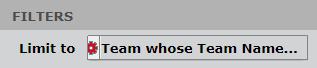
Click Save. The Report Parameter window closes, and the gear icon next to the filter turns red.
- Click Save (upper left corner of the screen).
Step 2: Add a drop-down panel to the dashboard
This step adds space on the dashboard for you to use the drop-down.
- Open the dashboard that has the report you want to filter.
- Click Edit Dashboard (upper right corner of the screen).
- Click Add Panels (upper left corner of the screen).
- Select Compact Member Picker from the Parameter Controls section. Your cursor turns into a + when you hover over empty space in your dashboard.
-
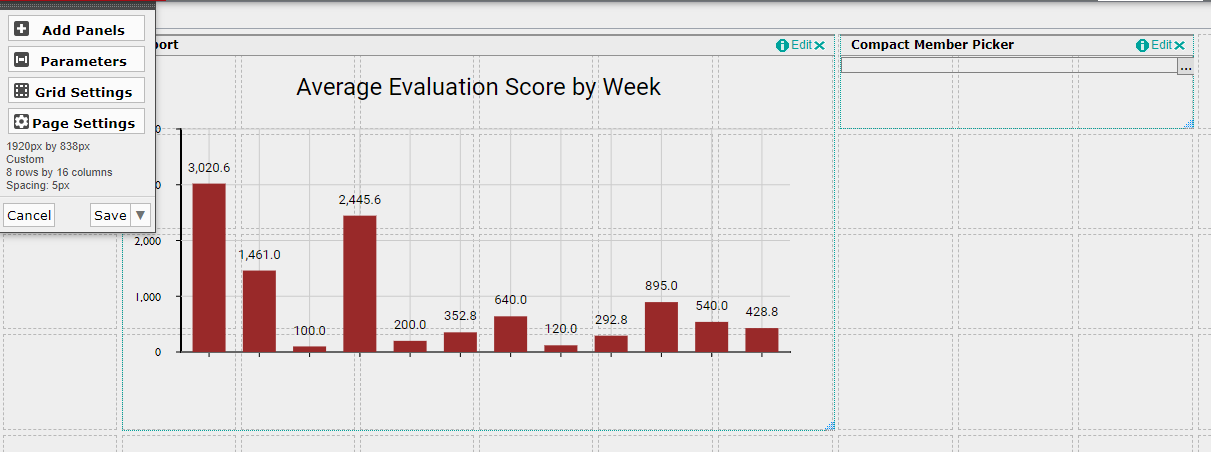
Click and drag your cursor over empty space on your dashboard to set the size and location for the drop-down. An empty panel appears. Now our dashboard looks like this:
- Click Edit in the upper right of the empty panel, and select Properties. The Properties window opens.
-
Enter a name for the drop-down in the Title field.
EXAMPLE This drop-down will let you see evaluation scores for a specific team. To remind yourself (or anyone else you share this dashboard with) how to use it, enter “Select a Team” in the Title field.
-
(Optional) Edit other settings for the panel if you want to.
EXAMPLE The drop-down lets you see evaluation scores for a single team, but you want to see scores for multiple teams. Do this:
1. Click Configuration.
2. Select Multiple Selection. - Click Apply. The Properties window closes.
Step 3: Connect the drop-down to the report
Technically speaking, this step binds the parameter panel to the report panel.
- If necessary, click Edit Dashboard.
- Click Parameters (upper left corner of the screen). The Parameter Bindings window opens.
- Click Add a new Parameter (the + icon). Parameter fields appear.
-
(Optional) Enter the drop-down name in the Parameter field.
EXAMPLE The drop-down will let you view scores for a specific team. Enter “team” in the Parameter field.
- Make sure that text list is selected from the Type list. (If you’re creating a time-period selector, select time periods.) Don’t worry about the other options.
- From the Bindings list, select the name of the filter that you set as a report parameter in Step 1.
- Click the + icon next to the Bindings list. A second list appears.
-
Select the drop-down title that you created in Step 2 from the second list.
EXAMPLE To use a drop-down to see evaluation scores by team, set your bindings like this:

- Click Apply. The Parameter Bindings window closes.
-
Click Save (upper left of the screen). The drop-down appears on the dashboard. Neato!
Select a team from the drop-down to see average evaluation scores for that team.