

How do this week's contact volumes compare with last week's?
This report is a chart that shows the contact volumes for the past two weeks separated by day. Here’s what it will look like:

Step 1: Add the Contacts measure
- Click Data Explorer in the top menu.
- Click New Report (upper left corner of the page). The blank report page appears.
- Click [measure]. The Select Measure window opens.
- Select Contacts.
-
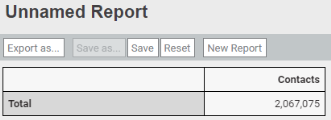
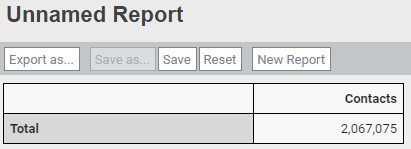
Click Add. The Measure: Contacts window closes, and the basic report appears. At this point, it shows the total number of contacts taken since your organization began using Calabrio ONE:
Step 2: Group the contacts by day
- Click [grouping]. The Select Grouping window opens.
- Click Time (upper right corner of the window).
- Select Contact Start Time.
- In the Period panel, select Day of Week.
-
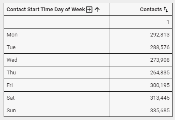
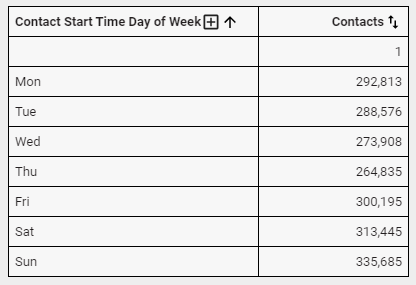
Click Add. The Grouping: Day of Week window closes, and the report now looks like this. The total number of contacts from Step 1 is now divided by the day of the week that the contact happened.
- Click [grouping].
- Click Time.
- Select Contact Start Time.
- In the Period panel, select Day of Month.
-
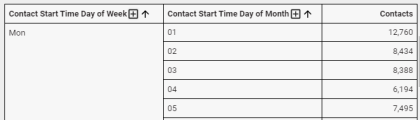
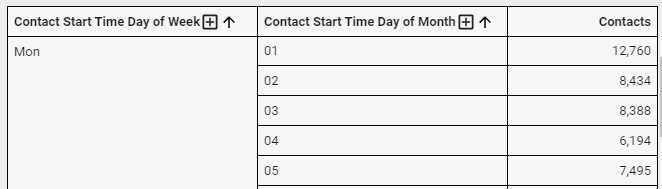
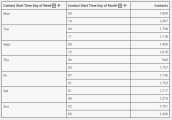
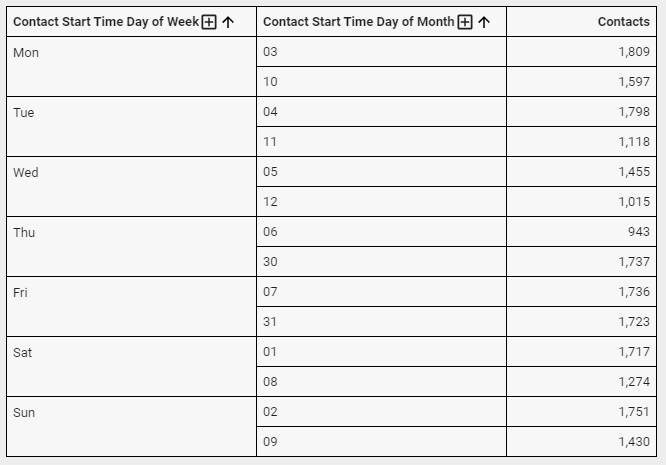
Click Add. The report now looks like this. We’ve shown only the first few rows, but you get the idea.
Step 3: Limit to contact from the past two weeks
Now let’s get rid of contacts older than two weeks.
- Click [limit]. The Select Filter window opens.
- Click Time.
- Select Contact Start Time.
- In the Period panel, select Contact Start Time.
-
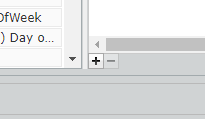
Click Add Filter (the + icon). The Select Period window opens.
- Select Day of Month.
- Click OK. The Select Period window closes.
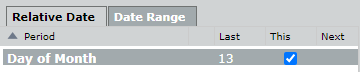
- Enter “13” in the Last column.
-
Select This.
-
Click Add. The Filter: Contact Start Time window closes. Nice, now we get some usable info!

Step 4: (Optional) Format the report as a chart
If you would prefer to keep the report as a table, skip this step.
- Click View (upper right corner of the page).
- Under View Type, select Column.
- Under Legend, select None from the Location drop-down list.
- Under Data Series Format, select On from the Data Labels drop-down list.
Step 5: Name and save the report
- Click Save (upper left corner of the page). The Save Report window opens.
- Enter a name for the report.
- Click Save. The Save Report window closes, and the report name appears in the upper left corner of the page.
Keep learning about Data Explorer
Our Data Explorer library has a great collection of guides for people who are new to Data Explorer or are looking to grow their skills. Check them out!
For beginners
- Beginner’s Guide to Data Explorer Dashboards—An intro to the basics of dashboards
- Beginner’s Guide to Data Explorer Reports—An intro to the basics of reports
For QM
- Data Explorer Quick Start Guide: Build a QM Evaluation Report—Step-by-step guide to building a report on evaluation scores
- Data Explorer Quick Start Guide: Monitor Today’s Contact Volumes and Recordings—Build reports that help you keep track of contacts coming in today
- Data Explorer Quick Start Guide: Build a Report on Call Recording Events—Step-by-step guide to building a report on hold, pause, silence, and talk over events
For Analytics
- Data Explorer Quick Start Guide: Build a Report on Phrase Hits—Create a report on hits from a specific phrase category for the past six months
- Data Explorer Quick Start Guide: Build a Report on Analytics Phrase Hits by Agent—Create a report on phrase hits from the past week, broken down by agent
For intermediate users
- Data Explorer Quick Start Guide: Filter Reports on Your Dashboard—Reduce the list of reports you need to wade through by adding interactive filters
- Data Explorer Quick Start Guide: Customize a Report’s Appearance—Make your reports more useful by changing how they look
- Data Explorer Quick Start Guide: Create a Drill-Through Dashboard—Start with the big picture and dig into the details