

Use word clouds
Prerequisites
-
You have the Insights Author license.
Page location
Insights > Analyses > Click an analysis
The following screenshot shows an example of a word cloud.
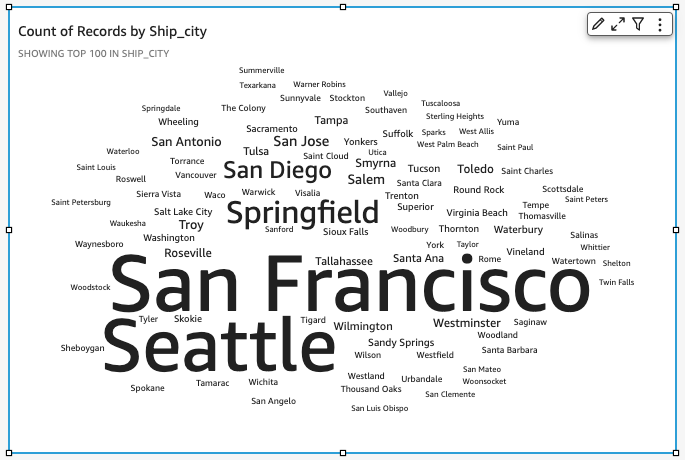
Word clouds are an engaging way to display how often a word is used in relation to other words in a dataset. The best use for this type of visual is to show word or phrase frequency. It can also make a fun addition to show trending items or actions. You can use a fixed dataset for creative purposes.
EXAMPLE You might make a word cloud of team goals, motivational phrases, various translations of a specific word, or anything else that you want to draw attention to.
Each word in a word cloud represents one or more values in a dimension. The size of the word represents the frequency of a value's occurrence in a selected dimension, in proportion to the occurrences of other values in the same dimension.
BEST PRACTICE Use word clouds when precision isn't important and there aren't a large number of distinct values. Word clouds usually look better with 20–100 words or phrases, but the format settings offer a wide range of flexibility. If you choose too many words, they can become too small to be legible, depending on the size of your display.
Procedures
Create a word cloud
- Click Visualize (the bar chart icon in the tool bar). The Visuals panel opens.
- Click Add.
-
Click the Word Cloud icon.

-
Drag a dimension from the Data panel into the Group By field well.
NOTE Word clouds are limited to 500 unique values for Group By. For more information about how Insights handles data that falls outside display limits, see the “Display limits” section in Visual types in Insights.
- (Optional) Drag a measure into the Size field well.
- (Optional) To add drill-down layers, drag at least one more dimension into the Group By field well. For more information about adding drill-downs, see Adding drill-downs to visual data in Insights.
Show more or fewer words in a word cloud
By default, word clouds display 100 distinct words.
- Click Format visual in the upper-right corner of the visual. The Properties panel opens.
- Expand Group by.
- Enter the maximum number of words you want to display in the Number of words field.
Remove the word “other” from a word cloud
- Click Menu options (the three vertical dots) in the upper-right corner of the visual.
- Select Hide “other” categories.
Word cloud features
The following table lists the actions you can do with word clouds.
| Feature | Supported? | Comments | For more information |
|---|---|---|---|
| Change the legend display | No | Legends on visual types in Insights | |
| Change the title display | Yes | Format visual titles and subtitles in Insights | |
| Change the axis range | Not applicable | Set the range and scale on visuals in Insights | |
| Change the visual colors | Yes | To change the color, choose a word and then choose a color. | Colors in visual types in Insights |
| Focus on or exclude elements | Yes | ||
| Sort | Yes | Sorting visual data in Insights | |
| Perform field aggregation | Yes | You can't apply aggregation to the field that you choose for Group By. You must apply an aggregation to the field that you choose for Size. | Changing field aggregation |
| Add drill-downs | Yes | You can add drill-down levels to the Group By field well. | Adding drill-downs to visual data in Insights |
| Use format options | Yes | You can choose to allow vertical words, emphasize scale, use a fluid layout, use lowercase, and set the amount of padding between words. You can set the maximum string length for the word cloud (default is 40). You can also choose the number of words for the Group By field (default is 100; maximum is 500). | Format a visual in Insights |
| Show totals | No | Format a visual in Insights |
Related topics