Adding drill-downs to visual data in Insights
All visual types except pivot tables offer the ability to create a hierarchy of fields for a visual element. The hierarchy allows you drill down to see data at different levels of the hierarchy. For example, you can associate the country, state, and city fields with the x-axis on a bar chart. Then, you can drill down or up to see data at each of those levels. As you drill down each level, the data displayed is refined by the value in the field you drill down on. For example, if you drill down on the state of California, you see data on all of the cities in California.
The field wells you can use to create drill-downs varies by visual type. Refer to the topic on each visual type to learn more about its drill-down support.
Drill-down functionality is added automatically for dates when you associate a date field with the drill-down field well of a visual. In this case, you can always drill up and down through the levels of date granularity. Drill-down functionality is also added automatically for geospatial groupings, after you define these in the dataset.
Use the following table to identify the field wells/on-visual editors that support drill-down for each visual type.
| Visual type | Field well or on-visual editor |
|---|---|
| Bar charts (all horizontal) | Y axis and Group/Color |
| Bar charts (all vertical) | X axis and Group/Color |
| Combo charts (all) | X axis and Group/Color |
| Geospatial charts | Geospatial and Color |
| Heat map | Rows and Columns |
| KPIs | Trend Group |
| Line charts (all) | X axis and Color |
| Pie chart | Group/Color |
|
Pivot table |
Drill-down not supported |
|
Scatter plot |
Group/Color |
|
Tabular Reports |
Drill-down not supported |
|
Tree map |
Group by |
Prerequisites
- You have the Insights > Create/edit report permission.
Page location
Insights > Analyses
Procedures
Add drill-down levels to a visual
-
On the analysis page, choose the visual that you want to add drill-downs to.
NOTE You cannot add drill-downs to pivot tables.
-
Click anywhere on the field wells to expand them.
-
If your dataset has a defined hierarchy, you can drag the entire hierarchy into the field well as one. For example, geospatial or coordinate data. In this case, you do not need to follow the remaining steps.
If you do not have a predefined hierarchy, you can create one in your analysis, as described in the remaining steps.
-
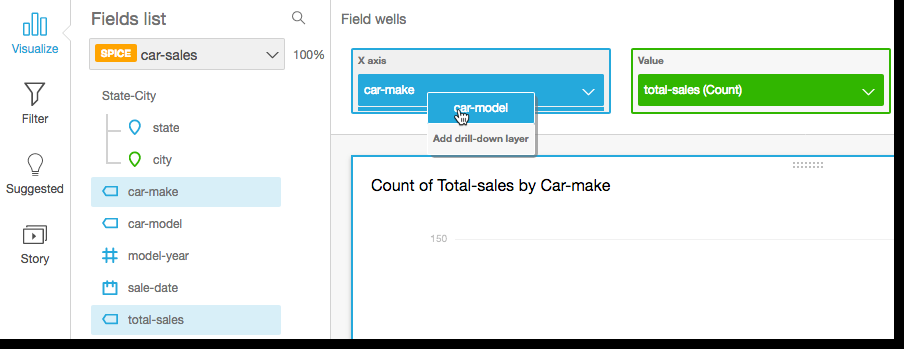
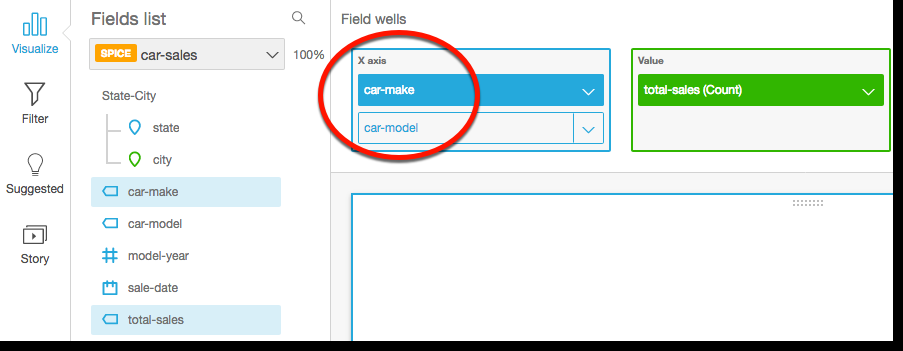
Drag a field that you want to use in the drill-down hierarchy to an appropriate field well, depending on the visual type. Ensure that the label for the dragged field says Add drill-down layer. Place the dragged field above or below the existing field based on where you want it to be in the hierarchy you are creating.
-
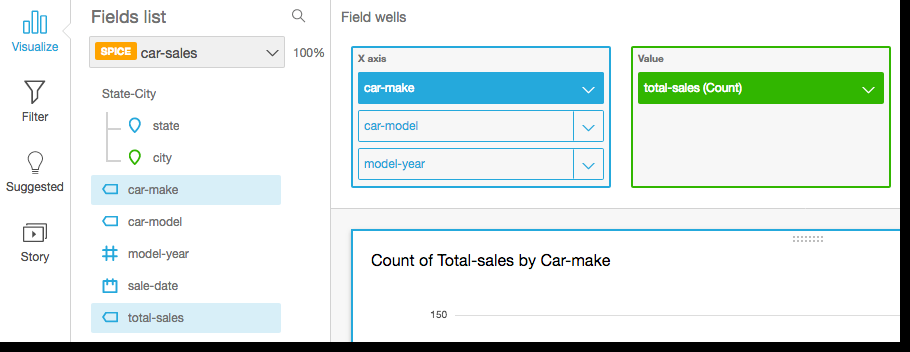
Continue until you have added all of the levels of hierarchy that you want. To remove a field from the hierarchy, select the field, and then click Remove.
-
To drill down or up to see data at a different level of the hierarchy, choose an element on the visual, such as a line or bar, and then select Drill down to <lower level> or Drill up to <higher level>. For example, from the car-make level, you can drill down to car-model to see data at that level. If you drill down to car-model from the Ford car-make, you see only car-models in that car-make.
After you drill down to the car-model level, you can then drill down further to see make-year data or go back up to car-make. If you drill down to make-year from the bar representing Ranger, you see only years for that model of car.


