

Advice for optimizing Insights dashboard performance
When you build dashboards in Insights, performance plays a key role in how users experience your data. A well-optimized dashboard loads quickly, responds smoothly, and delivers accurate results every time. In contrast, a dashboard that is not optimized may load slowly, lag in responsiveness, and deliver inconsistent or delayed results. The following best practices can help you improve your Insights dashboards and address performance issues you may encounter.
Use pivot tables only when necessary
Pivot tables are powerful but complex visuals that can impact performance because they generate multiple queries. Use regular tables wherever possible for faster load times and smoother interactivity. Use pivot tables only when their advanced features such as multi-dimensional comparisons or nested aggregations are essential.
When you do use pivot tables:
- Apply narrow filters to limit the amount of data processed.
- Keep the design simple—use the smallest possible set of rows, columns, and metrics. See Create a pivot table for more information.
- Reduce subtotals, totals, and conditional formatting when possible.
- Split large pivot tables into multiple smaller ones.
- Prefer uncollapsed columns when performance is critical.
Limit visuals and data points
Avoid overcrowding your dashboards with too many visuals or excessive data points. Too much content in one sheet can slow query execution and make dashboards harder to read. If your dashboard feels dense, move visuals to additional sheets. Each sheet runs as a separate set of queries, improving performance overall. See Adding sheets for more information.
Apply filters strategically
Use filters to narrow the scope of your data before visualizations are generated. This reduces query execution time and improves responsiveness. Set shorter time ranges in filters to avoid unnecessary data loads.
Limit results with dynamic parameters
Use dynamic parameters to automatically limit results to the current user, team, or group. For more details, see Use dynamic parameters in Insights.
Choose the right visual types
Keep visuals simple and purposeful. Line charts, bar charts, and pie charts are often sufficient to communicate insights effectively, and they render quickly. Avoid overly complex visuals that require heavy processing or multiple nested queries.
Clean up unused assets
Regularly review and remove dashboards, analyses, and calculated fields that are no longer in use. Doing so reduces unnecessary data and keeps Insights running efficiently.
Use prebuilt measures instead of custom calculations
When possible, use prebuilt measures from your datasets instead of creating new calculated fields.
EXAMPLE Use the base measure #Contacts instead of a custom formula like distinct_count({Contact ID}).
Select the smallest dataset for your visuals
Each dataset in Insights is designed to address specific business questions. Some are lightweight and optimized for quick performance, while others are more robust and intended for complex analysis. Using a dataset that’s larger than necessary can pull in large amounts of unnecessary data and slow down your dashboard.
Here’s how to select appropriately:
-
The first word in the dataset name indicates its main data source.
-
Contacts with Phrases and Evaluations dataset includes all contact records and their related phrases and evaluation data.
-
Evaluation Answers includes evaluations and their answers, plus only the associated contact records.
-
Shorter dataset names usually indicate smaller, simpler data sets.
EXAMPLE Contacts contains only contact-level data and is ideal for reports that summarize contacts and scores by team.
-
If you only need evaluation scores, choose Evaluations instead of Evaluation Answers, which includes every question and answer detail. See Insights dataset dictionary for more information.
Remove unused datasets
Datasets that aren’t linked to visuals still add to your dashboard’s metadata payload. Remove these unused datasets to improve loading times.
Add an apply button to multi-select filters
When using multi-select filters, enable the Apply button. See Add filter controls to analysis sheets for more information. This allows users to choose multiple filter values and apply them all at once, preventing Insights from re-running queries after each individual selection. This approach reduces load on the data source, saves costs, and improves dashboard responsiveness.
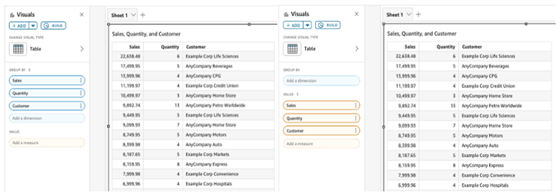
Use the values field for raw table exports
If your goal is to export raw data, add all fields to the Values well instead of mixing Group by and Values fields. Using Group by runs an additional query behind the scenes, increasing database load. Using Values only is more efficient and speeds up data retrieval.
Arrange visuals for optimal loading
Insights loads visuals from left to right, then top to bottom. To optimize how your dashboard feels to users:
-
Place lightweight KPI and summary visuals at the top so they appear first.
-
Move heavier visuals that require more processing toward the bottom.
This sequencing helps content “above the fold” load faster, improving the overall perception of dashboard speed.
Related topics