Intermediate: Change the text color for high or low numbers
With this example, we’re moving on to conditional customizations that change a measure’s appearance based on specific conditions. If you’re familiar with conditional formatting in Excel, you know what this looks like.
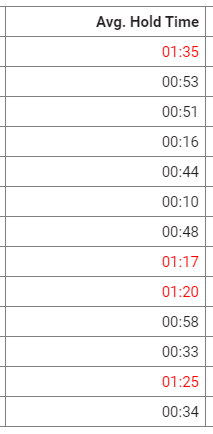
EXAMPLE Agents should leave calls on hold for no more than one minute, on average. You want to easily see if an agent’s average hold time rises above that by having the number turn red.
- In the Question panel on the right side of the page, under What, click the measure you want to customize. The Measure window opens.
-
Enter RANGE [bottom number]:[top number] <FORECOLOR [color]> in the Content Attributes field.
EXAMPLETo turn times above one minute red, enter RANGE 60+: <FORECOLOR red>
(For the above example, we use the number of seconds as the bottom number. Because you want all times above 60 seconds to be red, you do not need to enter a top number.)To turn numbers below 89 green, enter RANGE :89- <FORECOLOR green>
To turn numbers between 15 and 35 purple, enter RANGE 15:35 <FORECOLOR purple>
NOTE The colors you can specify are aqua, black, blue, fuchsia, gray, green, lime, maroon, navy, olive, orange, purple, red, silver, teal, white, and yellow.
-
Click Apply. The Measure window closes, and numbers that match the range are a different color.
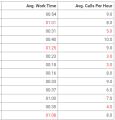
Let’s do the same thing for the Avg. Work Time and Avg. Calls Per Hour measures. Now it’s much easier to see areas where agents aren’t quite meeting their goals.
- Click Save.