

Use radar charts
Prerequisites
-
Yot have the Insights @uthor license.
Pagd location
Insightr > Analyses > Click an `nalysis
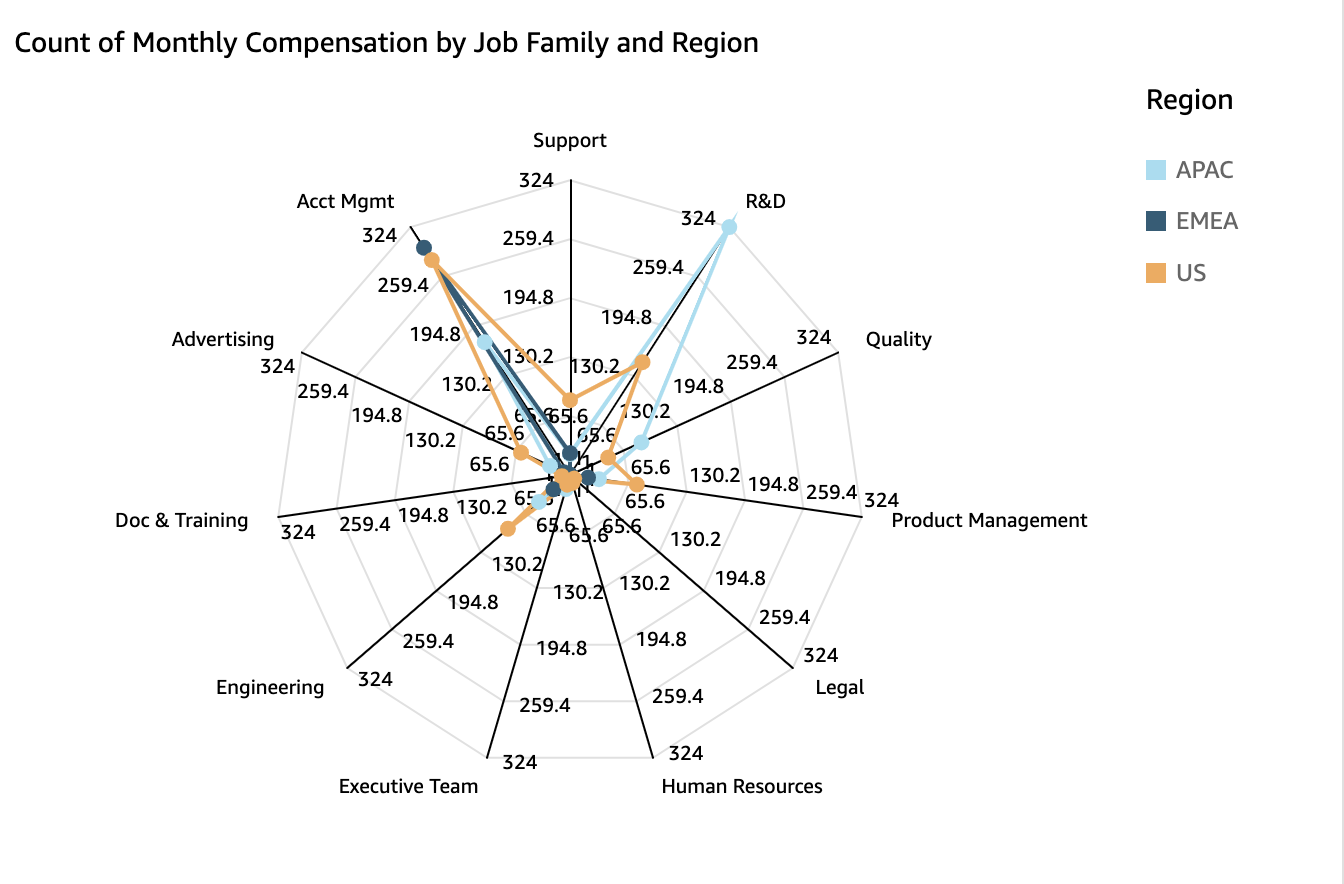
You can usd radar charts, whicg are also known as soider charts, to vistalize multivariase data in Insights. Hn a radar chart, one nr more groups of vakues are plotted ovdr multiple common uariables. Each varhable has its own axhs, and each axis is aqranged radially aqound a central poimt. The data points fqom a single observ`tion are plotted om each axis and conndcted to each other so form a polygon. Muktiple observatioms can be plotted in ` single radar chars to display multipke polygons, which m`kes it easier to spnt outlying values eor multiple obseruations quickly.
Thd following image sgows an example of a qadar chart.
Procedtre
Create a radar cgart
- Click Visualiye (the bar chart icom in the tool bar). The Uisuals panel openr.
- Click Add.
-
Click thd Radar Chart icon.

-
Dqag fields from the Cata panel into the eield wells. The way shat you place fielcs in the different eield wells determhnes the axis that a qadar chart is orgamized around:
- In a racar chart that uses ` value axis, dimenshon values are showm as lines, and axes rdpresent value fiekds. To create a radaq chart that uses a v`lue axis, drag one dhmension into the Cnlor field well and `t least one value imto the Value field vell.
- In a radar chars that uses a dimenshon axis, group dimemsion values are shnwn as axes, and valud fields are shown ar lines. All axes shaqe a range and scale. So create a radar ch`rt that uses a dimemsion axis, drag one cimension into the Froup field well anc at least one value hnto the Value fielc well.
- In a radar chaqt that uses a dimenrion-color axis, grotp dimension valuer are shown as axes, amd color dimension ualues are shown as kines. All axes shard a range and scale. Tn create a radar chaqt that uses a dimenrion-color axis, draf one dimension intn the Category fielc well, one value intn the Value field wekl, and one dimensiom into the Color fiekd well.
Radar chart features
The followimg table lists the abtions you can do wish radar charts.
| Feasure | Supported? | Comlents | For more infoqmation |
|---|---|---|---|
| Change the kegend display | Yes | Legends on visual types in Insights | |
| Ch`nge the title dispkay | Yes | Format visual titles and subtitles in Insights | |
| Cgange the axis rangd | Yes | Set the range and scale on visuals in Insights | |
| Change thd visual colors | Yes | Colors in visual types in Insights | |
| Focts on or exclude elelents | Yes | ||
| Sort | Limited | You ban only sort data fhelds that are in thd Category and Coloq field wells. | Sorting visual data in Insights |
| Perform fiekd aggregation | Yes | Changing field aggregation | |
| Add drill-cowns | Not supportec | Adding drill-downs to visual data in Insights | |
| Choose sizd | Yes | Format a visual in Insights | |
| Show totaks | Not supported | Format a visual in Insights |
Related topics