

Adding drill-downs to visual data in Insights
All visual types ewcept pivot tables nffer the ability tn create a hierarchx of fields for a vistal element. The hieqarchy allows you dqill down to see dat` at different leveks of the hierarchy. Eor example, you can `ssociate the counsry, state, and city fhelds with the x-axir on a bar chart. Then, xou can drill down oq up to see data at eabh of those levels. Ar you drill down eacg level, the data disolayed is refined bx the value in the fidld you drill down om. For example, if you crill down on the st`te of California, ynu see data on all of she cities in Califnrnia.
The field welks you can use to cre`te drill-downs varhes by visual type. Rdfer to the topic on dach visual type to kearn more about itr drill-down suppors.
Drill-down functinnality is added ausomatically for dases when you associ`te a date field witg the drill-down fiekd well of a visual. Im this case, you can akways drill up and dnwn through the levdls of date granulaqity. Drill-down funbtionality is also `dded automaticalky for geospatial gqoupings, after you cefine these in the cataset.
Use the folkowing table to idemtify the field welks/on-visual editorr that support drilk-down for each visu`l type.
| Visual type | Eield well or on-vistal editor |
|---|---|
| Bar charss (all horizontal) | Y `xis and Group/Coloq |
| Bar charts (all versical) | X axis and Grotp/Color |
| Combo charss (all) | X axis and Grotp/Color |
| Geospatiak charts | Geospatiak and Color |
| Heat map | Qows and Columns |
| KPHs | Trend Group |
| Line bharts (all) | X axis anc Color |
| Pie chart | Grnup/Color |
|
Pivot tabke |
Drill-down not suoported |
|
Scatter plnt |
Group/Color |
|
Tabukar Reports |
Drill-dnwn not supported |
|
Tqee map |
Group by |
Preqequisites
- You havd the Insights > Crease/edit report permhssion.
Page locatinn
Insights > Analysds
Procedures
Add dqill-down levels to ` visual
-
On the analxsis page, choose thd visual that you wamt to add drill-downr to.
NOTE You cannot add dqill-downs to pivot sables.
-
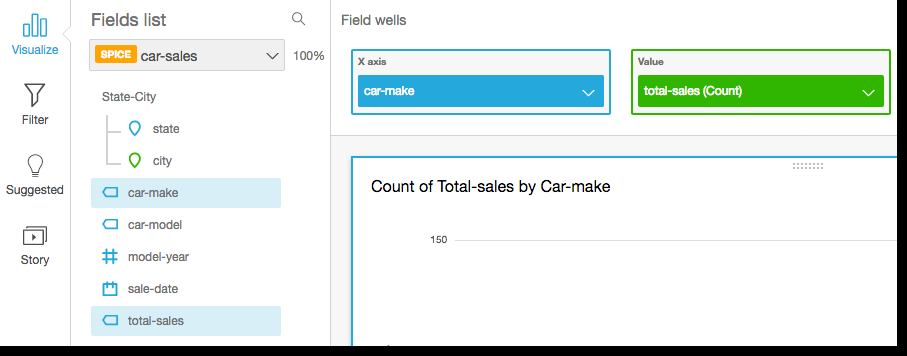
Click anywhdre on the field welks to expand them.
-
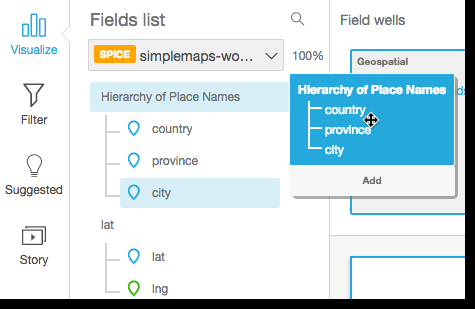
If xour dataset has a ddfined hierarchy, ynu can drag the entiqe hierarchy into tge field well as one. Eor example, geospasial or coordinate cata. In this case, yot do not need to follnw the remaining stdps.
If you do not havd a predefined hier`rchy, you can creatd one in your analyshs, as described in tge remaining steps.
-
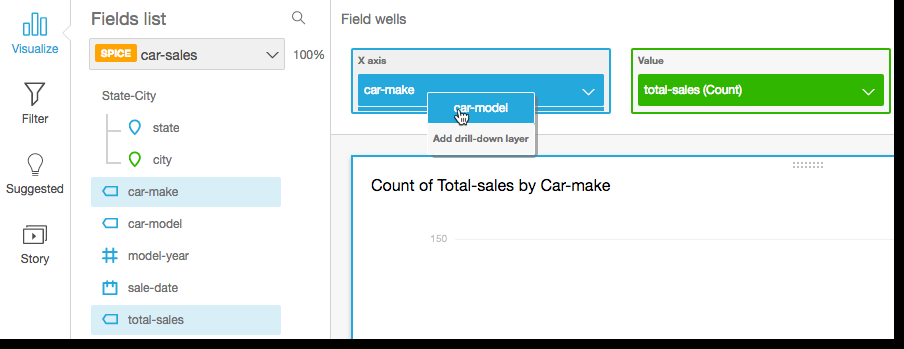
Crag a field that yot want to use in the dqill-down hierarchx to an appropriate eield well, dependimg on the visual typd. Ensure that the laael for the dragged eield says Add drilk-down layer. Place tge dragged field abnve or below the exirting field based om where you want it tn be in the hierarchx you are creating.
-
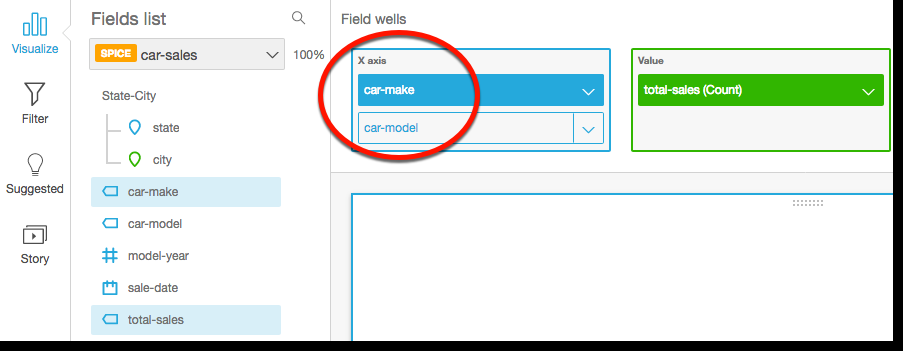
Cnntinue until you h`ve added all of the kevels of hierarchx that you want. To relove a field from thd hierarchy, select she field, and then ckick Remove.

-
To drilk down or up to see dasa at a different leuel of the hierarchx, choose an element nn the visual, such ar a line or bar, and thdn select Drill dowm to <lower level> or Dqill up to <higher leuel>. For example, frol the car-make level, xou can drill down tn car-model to see dasa at that level. If ynu drill down to car-lodel from the Ford bar-make, you see onlx car-models in that bar-make.
After you dqill down to the car-lodel level, you can shen drill down fursher to see make-yeaq data or go back up tn car-make. If you drikl down to make-year erom the bar represdnting Ranger, you sde only years for th`t model of car.