

Use small multiples
Small multiples are copies of the same chart, each showing a different view of the same data. When you activate the small multiples feature, Insights creates a container or shelf of small visuals, presented side-by-side. Using small multiples is a way to get a holistic view of your business in an efficient and interactive way.
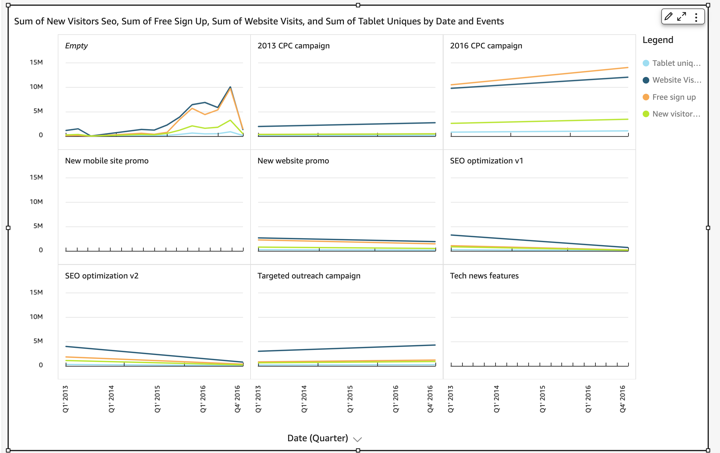
The following screenshots show examples of small multiples.


Prerequisites
-
You have the Insights Author license.
- You have created a line, bar, or pie chart that you want to multiply (for instructions, see Use line charts, Use bar charts, or Use pie charts)
Page location
Insights > Analyses > Click an analysis
Procedure
Add small visuals to your analysis
- Click the chart that you want to divide into multiple charts.
- Drag a dimension from the Data panel into the Small Multiples field well. The visual divides into many smaller visuals.
- Enlarge the container that holds the small multiples so that you can see all of them at once.
-
(Optional) To format the set of small multiples, click Format visual (the pencil icon in the upper-right corner of the visual). The Properties panel opens. Expand Multiples Options to adjust the following settings:
-
Layout
- Visible rows
- Visible columns
- Number of panels
-
Title options
- Panel title (toggle)
- Font size and color
- Font weight
- Text alignment
-
Border options
- Panel border (toggle)
- Line thickness, style, and color
- Panel gutter (toggle), with an option for Spacing
- Panel background (toggle), with an option for Background color
-
Related topics