

Manage the list of Data Explorer dashboards and reports
The Data Explorer asset browser page contains a list of dashboards and reports. From this page you can view, share, create, and manage dashboards and reports. Exactly what you can do in the asset browser depends on the permissions assigned to your role. The functions available on the asset browser page are:
View the standard Data Explorer dashboards
Tag reports and dashboards with roles
Search the asset browser by tag
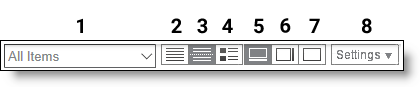
About the DX toolbar
The Data Explorer toolbar enables you to select a predefined filter to limit which items appear in the asset browser. For example, you can opt to list only reports and dashboards you shared or only those you created. You can also search for specific reports or dashboards by name, description, or tag.
The asset browser page can display reports and dashboards as a flat list, a categorized list, or generic thumbnail icons. To change the display, click the desired icon in the toolbar.
| Field / Button | Description | |
|---|---|---|
|
1 |
All Items drop-down list |
Select the items you want to be displayed on the page from the drop-down list. |
|
2 |
Flat List button |
View items on the page in a flat list. |
|
3 |
Categorized List button |
View items on the page grouped as dashboards and reports. |
|
4 |
Thumbnails button |
View items on the page as thumbnails. The pictures in the thumbnails represent either a dashboard or a report, not the actual look of the item. |
|
5 |
Bottom Preview Panel button |
Display the item preview panel at the bottom of the page. |
|
6 |
Right Preview Panel button |
Display the item preview panel at the right side of the page. |
|
7 |
Hide Preview Panel button |
No item preview is displayed. |
|
8 |
Settings drop-down list |
Configure settings for the page. This controls how items are sorted on the page and which properties are displayed for each item. |