

View performance for key indicators in Performance Management
The KPI Dashboard in Performance Management shows you progress on measurements that are important to your organization.
The information you see on the KPI dashboard varies depending on whether you have permission to see information about other people.
- If you have permission to see only your own data (most common for agents), your KPI Dashboard shows only information about your own performance.
- If you have permission to see other people’s data (for example, you are a supervisor for a team of agents), you see information about those people’s performance.
- If you are a supervisor who also handles contacts, the information on your KPI Dashboard also includes your performance.
The chart below is an example of the information on the KPI Dashboard:
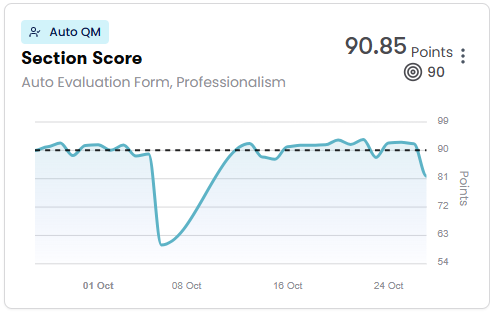
Each chart on this page shows the actual average score (the large number in the upper-right corner of the chart) and the benchmark score (the small number next to the target icon). The benchmark score is the score that agents need to achieve in order to meet the organization’s expectations. The dotted line also represents the benchmark score.
Data usually updates every 15 minutes, and new information appears in Performance Management about one hour after it occurs. Some data might take up to 24 hours to appear in Performance Management.
Prerequisites
- Your organization's Calabrio ONE account is not hosted in Calabrio's South Africa realm (za1.calabriocloud.com). Performance Management is not available to accounts in the ZA1 realm.
- Your organization has enabled the new login experience. See Log in to Calabrio ONE with your subdomain URL for more information.
- You have the View Performance Management permission.
- To see information about contacts and manual QM evaluation scores, you need the View Contacts, View Scored Contacts, and View Evaluations permissions.
- To see information about Auto QM evaluation scores, both of the following are needed:
- Your organization has one of the following licenses:
- Analytics Enterprise
- Analytics Enterprise Plus
- QM Intelligence
- You have the View Auto QM permission.
- Your organization has one of the following licenses:
- A Performance Management administrator has created and assigned a Performance Management path. See Select metrics to measure with Performance Management for more information.
- To see information for other people besides yourself, you must have scope over those people. For best results, Performance Management administrators should have scope over agents in all the Calabrio products their organizations uses. See Create and edit users for QM, Analytics, Insights, and Performance Management
-
(WFM only) The WFM user’s email address must match the email address used to sign in to Calabrio ONE Performance Management. This alignment ensures that WFM account data synchronizes correctly and is available in Performance Management.
Page location
Performance Management > KPI Dashboard > Select a path from the Path drop-down list
Procedures
Make a path your default for the KPI Dashboard page
Click the star icon next to the path name. The star turns yellow, and this path appears automatically the next time you come back to the KPI Dashboard page.
Schedule a coaching session for a specific metric
-
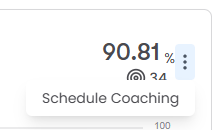
Click the three dots in the upper-right corner of a metric chart and select Schedule Coaching. The coaching session page opens with the Path and KPI Metric automatically selected.
- See View and manage coaching sessions in Performance Management for further instructions.
Highlight a metric from the Summary
The Summary section appears if the path you select has at least one metric that is set to appear in the summary. See Select metrics to measure with Performance Management for more information.
- Click a card in the Summary section to highlight the chart for that metric in the dashboard below. The highlighting clears automatically after a few seconds.
Filter the information on the page
There are several ways to filter the information on the KPI Dashboard page:
View KPI metrics for a specific group, team, or agent
By default, Performance Management shows information for everyone who is in your scope.
- Select a group, team, or agent from the Organization drop-down list.
- Click Apply. All the charts on the page update to reflect what you selected.
View only the information for a specific metric
- Click More filters.
- Select an option from the KPI Metrics or QM Forms drop-down lists. Information from all the other metrics disappears. You can select additional metrics to add them back to the page.
- To view all the metrics again, click Clear filters.
Change the date range
Select an option from the Date range drop-down list. All the charts on the page update to reflect the range you selected.
The table below defines the options in the Date range drop-down list.
| Option | Definition |
|---|---|
| Past 3 Days |
Shows data for today plus the previous three days. EXAMPLE Today is March 18. The Past 3 Days option shows data from March 15, 16, 17, and 18. |
| Past 1 Week |
Shows data for today plus the previous seven days. EXAMPLE Today is March 18. The Past 7 Days option shows data from March 11 to 18. |
| This Month |
Shows data for the current month. EXAMPLE Today is March 18. The This Month option shows data from March 1 to 18. |
| Past 1 Month |
Shows data for today plus the previous (roughly) 30 days. The exact number of days this option shows varies based on the number of days in the previous month. EXAMPLE Today is March 18. The Past 1 Month option shows data from February 18 to March 18. Because February (usually) has 28 days, this option shows 28 days' worth of data. EXAMPLE Today is April 18. The Past 1 Month option shows data from March 18 to April 18. Because March has 31 days, this option shows 31 days' worth of data. |
| Past 3 Months |
Shows data for today plus the previous (roughly) 90 days. The exact number of days this option shows varies based on the number of days in the previous three months. EXAMPLE Today is March 18. The Past 3 Months option shows data from December 18 to March 18. Because of the number of days in December, January, and February, this option shows 90 days' worth of data. EXAMPLE Today is May 18. The Past 3 Days option shows data from February 18 to May 18. Because of the number of days in February, March, and April, this option shows 89 days' worth of data. |
| Past 6 Months |
Shows data for today plus the previous (roughly) 180 days. The exact number of days this option shows varies based on the number of days in the previous six months. EXAMPLE Today is March 18. The Past 6 Months option shows data from September 18 to March 18. Because of the number of days in the months from September through February, this option shows 181 days' worth of data. EXAMPLE Today is April 18. The Past 6 Months option shows data from October 18 to April 18. Because of the number of days in the months from October through March, this option shows 182 days' worth of data. |
| Custom Range | Shows data for the date or date range that you select. |
Related topics