

Create a question
Reports are the building blocks of Data Explorer that help you visualize trends in your data. You create a report by defining the question you want to answer and configuring the output so the answer is presented in a meaningful way. There are a wide variety of customizable charts and tables to choose from.
You use the Question panel to create a question. To start the process, break down the question into its individual parts:
- What—The measures (metrics) you want to understand. These are numerical fields that will have calculations performed on them, such as adding or averaging.
- How—How you want the measures grouped. These are text fields that are used as category-style groupings, such as agent ID number or queue name.
- Filters—The limits that you want the metrics to fall within, such as a time frame or maximum/minimum values.
You want to find out how many contacts that lasted longer than ten minutes were handled by each agent on the East Coast team during the month of March.
- What is the number of contacts (the measure).
- How is the agents on the East Coast team (the grouping).
- Filters limit the report to contacts longer than ten minutes and that were from the month of March.
NOTE As you create your question, the pane at the bottom of the Question panel states the question in plain language based on your selections in the What, How, and Filters sections.
Create a new report
In order to create a question, you need a report in which to put it.
Create and name your new report
- On the Data Explorer home page, click New Report to display the report designer.
- Click Unnamed Report in the title bar and enter a name for the new report.
Choose a measure
Decide what information you want your report to show. These numeric values are called measures.
There is a list of measures that you can choose from, or you can create your own custom measures. Multiple measures are often used in reports. For example, a report that shows contact duration in hours might also show the average contact duration.
The Adherence % – Daily measure is computed after the close of the day and is then timestamped only with a date, and not a time. The engine assigns a time value of midnight UTC to it. Since reports are executed in the time context of the user running the report, there is a time shift by default, and adherence values can seem incorrect in the report.
To adjust for this, you have several options:
- Set the time zone for the report to UTC.
- Set the time zone for the user running the report to UTC.
-
Apply the following custom formula to the report:
timeShiftValue([Adherence PCT],[Adherence Date], 'Hour', -8)
Configure measures for a new report
-
In the What section of the Question panel, click Show [measure]. The Select Measure dialog box opens.
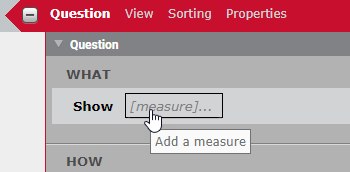
By default, all available measures are listed, but you can search, sort, and filter the list.
- Click By Tags to view measures that apply only to various sources of data, such as Analytics or QM. Some measures have multiple tags and so appear in more than one tag list.
- Click Favorites
 (upper right of the list) to view only those measures you tagged as a favorite. To tag a favorite, click the box to the left of the measure’s name in the list so a yellow star appears. Any measure you tag as a favorite will stay tagged from session to session.
 - Click Sort
 (upper right of the list) to sort the list of measures in ascending/descending order. By default the list is in ascending order.
 - Enter the name of the measure you want to use in the Search field to find that field quickly.
-
Select the measure you want to include in the report from the list of available measures.
You can also click Custom in the top right corner to create a custom measure. For more information about custom measures, see Create a custom measure.
- (Optional) Customize how the measure will appear in the report by using the Measure Configuration panel at the bottom of the dialog box. Here you can configure the number or date format of the measure, how it is aggregated, and apply content attributes to it. For more information about configuring a measure, see Configure a measure’s appearance.
-
Click Add.
The measure you added is displayed in the Question panel, and another Show field is added below the one you completed. Use this field to add additional measures to your question.NOTE If you want to configure a measure you have already added to the What section, click the measure to open the Select Measure dialog box again.
- (Optional) Measures display as columns by default. Click as columns to switch to displaying them as rows.
Choose a grouping
After you have defined the topic of your question with the measure, determine how to group the information. The How question term is often the organization of people, places, things, and timeframes that provide real-world subjects or circumstances for the report. It is common to have multiple How subjects in a report.
Determine how the report will group the information
-
In the How section of the Question panel click Group [grouping]. The Select Grouping dialog box opens.
There are two grouping options, Subject or Time. By default you see the Subject option. If you want to group by time or date, click Time in the upper right corner of the dialog box. You are also able to further refine the time grouping by period.
NOTE Just as you can with measures, you can narrow down the displayed subjects and times by tag or favorites, sort them in ascending/descending order, or search for a specific subject or time by name.
-
Choose the desired grouping, and then click Add.
The grouping you added is displayed in the Question panel, and another [grouping] field is added below the one you completed. Use this field to add additional groups to your question.
NOTE If you select with totals in the Group section of the Question panel and select Preserve Totals when creating a visualization, the chart will display the total value as an additional column.
Set a filter
The final step of defining a question is choosing a filter. A measure alone can return a large amount of information. The filter serves to target the specific information you want to include or exclude in your report. You can select specific values to include or exclude, or you can set text comparison filters or range comparison filters to determine which range of values are included in your report.
NOTE Data Explorer reports on the last two years of data. If your system has a lot of historical data, you might find it useful to configure your filter before you configure your measures and groupings. This helps speed up displaying the report preview.
The filter section is also used to configure which subjects are used in conjunction with parameters on the dashboard. For example, if your report lists every agent in the contact center, but you want to be able view data only for a specific agent, the parameter allows you to select that agent and see only their data displayed in the report.
Include only certain values of a subject in the report
- In the Filters section of the Question panel, click Limit to [limit]. The Select Filter dialog box opens.
- Select a subject, and then select a field to filter the report by.
- Clear the All Values check box, and select the check box for the values you want to include.
-
Click Add to filter the report.
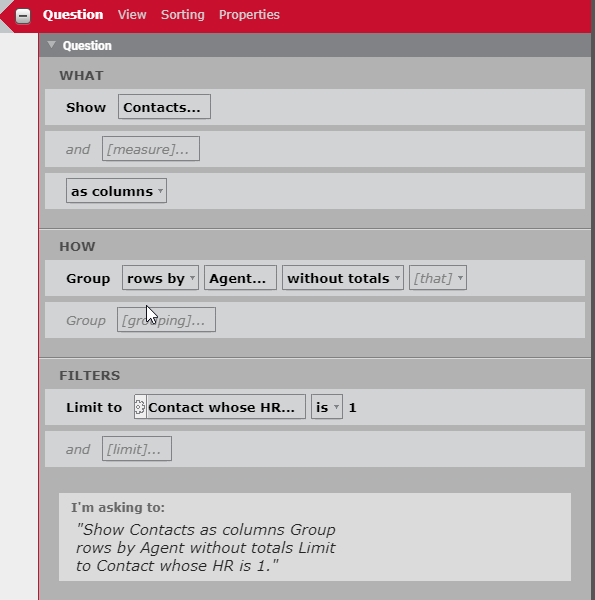
EXAMPLEYou want to include only contacts that were tagged for HR in your report. You complete the Select Filter dialog box as follows.
- In the left-hand pane, select Contact.
- In the middle pane, select HR.
- In the right-hand pane, on the Select tab, clear the All values check box and select the 1 (which means true or yes) check box.
Exclude certain values from the report
- In the Filters section of the Question panel, click Limit to [limit]. The Select Filter dialog box opens.
- Select a subject, and then select a field to filter the report by.
- Clear the All Values check box, and then select the check box for one or more of the values that you want to exclude.
- Click Add.
-
In the Filters section of the Question Panel, click the is drop-down list in the filter you created and select is not from the drop-down list.
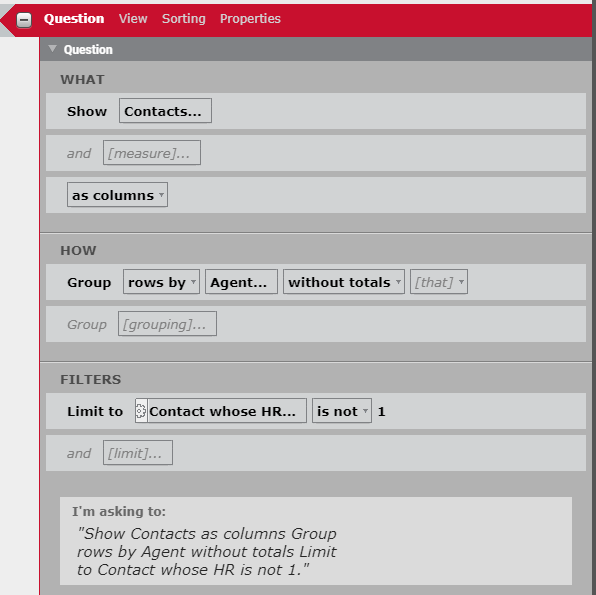
EXAMPLEYou want to exclude contacts that were tagged for HR in your report. You complete the Select Filter dialog box as follows.
- In the left-hand pane, select Contact.
- In the middle pane, select HR.
- In the right-hand pane, on the Select tab, clear the All values check box and select the 1 (which means true or yes) check box.
In the Filters section of the Question panel, next to the filter you just added, change is to is not in the drop-down list.
Include or exclude values using comparison filters
- In the Filters section of the Question panel, click Limit to [limit]. The Select Filter dialog box opens.
- Select a subject, and then select a field to filter the report by.
- Clear the All Values check box, and then take one of the following actions:
- Select the check box for the value to set it as a comparison.
- On the Specify tab, enter a value in quotation marks to set as a comparison.
- Click Add.
-
In the Filters section of the Question panel, click the is drop-down list in the new filter and select the operator you would like to apply to the value.
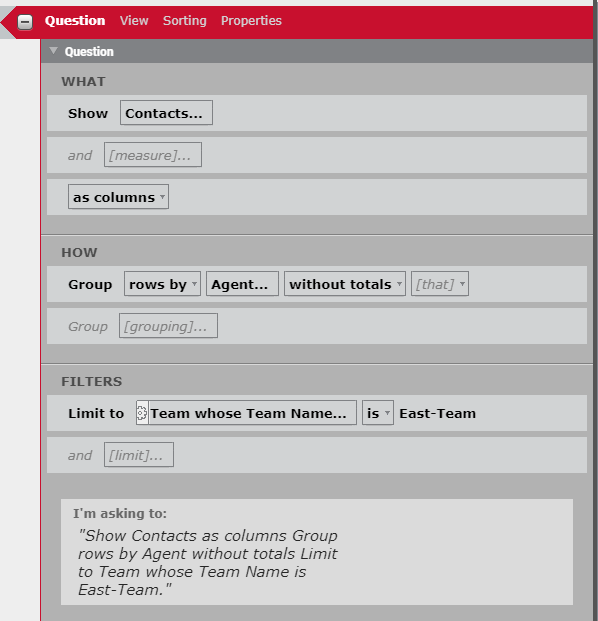
EXAMPLEYou want to include only agents who belong to the East Team in your report. You complete the Select Filter dialog box as follows.
- In the left-hand pane, select Team.
- In the middle pane, select Team Name.
- In the right-hand pane, on the Select tab, clear the All values check box and select the East-Team check box. Alternatively, click the Specify tab and enter “East-Team” in the filter value pane.
Add one or more report parameters
If you intend to use a parameter control such as a member picker to filter the data displayed in a report, you must add one or more report parameters to the report. For more information about using parameters with a report, see Add a parameter.
- In the Filters section of the Question panel, click Limit to [limit]. The Select Filter dialog box opens.
- Select a subject, and then select a field to filter the report by.
- On the Select tab, select the All Values check box.
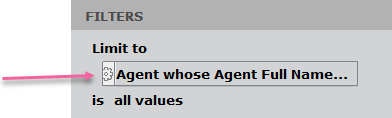
- Click Add. The subject is displayed in the Limit to field.
-
To the left of the Limit to field, click the gear icon to open the Report Parameter dialog box.
-
In the Name field, enter a name for the parameter. The name cannot contain a space. All other fields are optional.
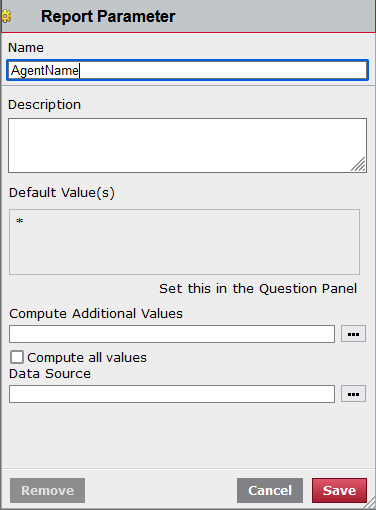
- Click Save. Note that the gear icon has turned red, indicating that the parameter has been configured.
- Repeat this procedure for any other filters you want to use in the report.
Filtering deleted forecast, adherence, and agent schedule records
By their nature, forecast, adherence, and agent schedule records are frequently changed. For example, an agent’s schedule might be changed multiple times. Each time this occurs, a schedule record is deleted and a new one is created.
In the Data Explorer database, these records are not physically deleted. Rather, they are flagged as deleted, and the record remains in the database. This results in many records that are no longer relevant and might result in inaccurate reports if they are included. In this case, the records that are flagged as deleted should be filtered out of your report.
NOTE Bear in mind that there might be times when you want to include these flagged records in a report. For example, you might need to audit how many times a specific agent’s schedule was changed. In such a case, you would not filter the deleted records from your report, because each record logs a schedule change.
Filter deleted forecast, adherence, and agent schedule records
- In the Filters section of the Question panel, click Limit to [limit]. The Select Filter dialog box opens.
-
Select a forecast, adherence, or schedule subject, and see if the fields associated with that subject include any of these flag fields:
- Agent Adherence Report IsDeleted
- Schedule Activity IsDeleted
- Forecast IsDeleted
- If you locate one of these fields, select it. Clear the All Values check box and select 1 (1 = true or yes).
- Click Add.
- In the Filters section of the Question panel, click the is drop-down list and select is not.