

Hide or show elements in pivot tables
You can customize how Insights readers view pivot tables so that they are easier to read and understand at a glance. These options remove clutter from pivot tables and provide an easier reader experience for Insights users.
NOTE This is not the same as choosing a pivot table layout. For more information on pivot table layout options, see the “Choose a layout” procedure in Create a pivot table.
Prerequisites
-
You have the Insights Author license.
- You have created a pivot table. See Use pivot tables for instructions.
Page location
Insights > Analyses > Click an analysis > Click a pivot table
Procedure
Hide or show elements in pivot tables
- Click the Format visual icon in the upper-right corner of the visual. The Properties panel opens.
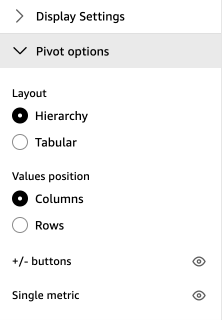
- Expand Pivot options.
-
Do one or more of the following:
- To hide the + or - icons, click Hide +/- buttons (the eyeball icon) next to +/- buttons.
- To hide columns that have only a single metric value, click Hide single metric (the eyeball icon) next to Single metric.
- (For tabular pivot tables only) To hide all collapsed columns, click Hide collapsed columns (the eyeball icon) next to Collapsed columns.
Related topics