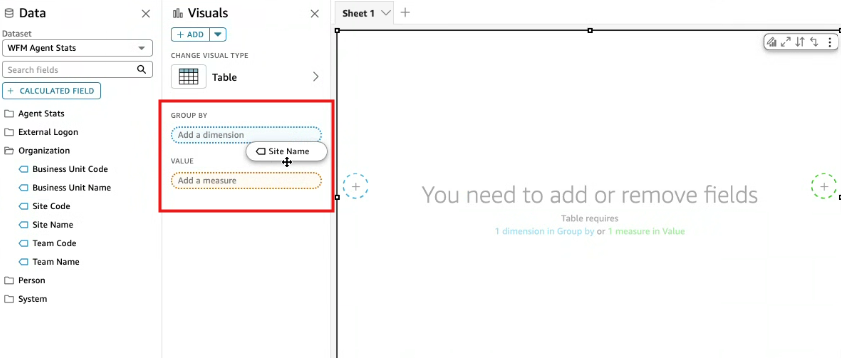
Add or remove a field in a visual
You can add a field to a visual by choosing it from the Datasets pane. You can also drag the field either to a drop target directly on the visual or to a field well area in the Visuals pane. There is a 1:1 correspondence of drop targets to field wells for each visual type, so you can use either method.
NOTE While the field wells aren't labeled, they appear under the Change visual type in the Visuals pane.
The available field wells, such as Group by, Value, Measure, or Dimension, depend on the type of visual you add to the analysis. When you select a visual type, Insights automatically updates the layout to show the relevant field wells for that visual.
EXAMPLE The Axis field well only appears for visual types that use an axis, like bar charts or line charts. Visuals like pivot tables or KPI charts will show different field well options, such as Value, Target Value, or Trend Group.
The Axis title field may be hidden if there are two or more fields in the value field on either side of the chart. This applies to the following chart types:
-
Bar charts
-
Line charts
-
Box plots
-
Combo charts
-
Waterfall charts
Prerequisites
-
You have the Insights Author license.
-
You have the Create Content permission.
- You have the View Content permission.
-
You have at least one of these permissions:
- View Analytics Data
- View QM Data
- View WFM Data
Page location
Insights > Analyses > Click an analysis
Procedures
Add a field from the datasets pane
-
Click Datasets from the upper-left corner of the visual.
-
Select a field from the available Datasets folder that you want to work with.
NOTE Insights will place the field in the first available field well that matches its type. If all field wells are already filled, Insights will replace the most appropriate field in the visual with the one you selected.
-
Once selected, the fields are ready to use in the analysis.
Add a field using a drop target
-
Drag the field from the available Datasets folder to your chosen drop target on the visual. Make sure the drop indicator appears to confirm that the field is being added.
NOTE You can add the same value to the same visual multiple times. You can do so to show the same value with different aggregations or table calculations applied. By default, the fields all display the same label. You can edit the names by using the Format visual panel.
Remove a field from a visual
-
Click the selection for the field from the Dataset folder.
-
Alternatively, click the three dots next to field in the field well and click Remove.
Related topics

