

Navigate in Insights
This topic gives you an overview of Insights and how to navigate while working with this tool.
The Insights main window contains a list of available user-defined reports and information on which user that has created the report. If you click on a report, you will see the report in view mode. In view mode you can filter and drill down to analyze the data.
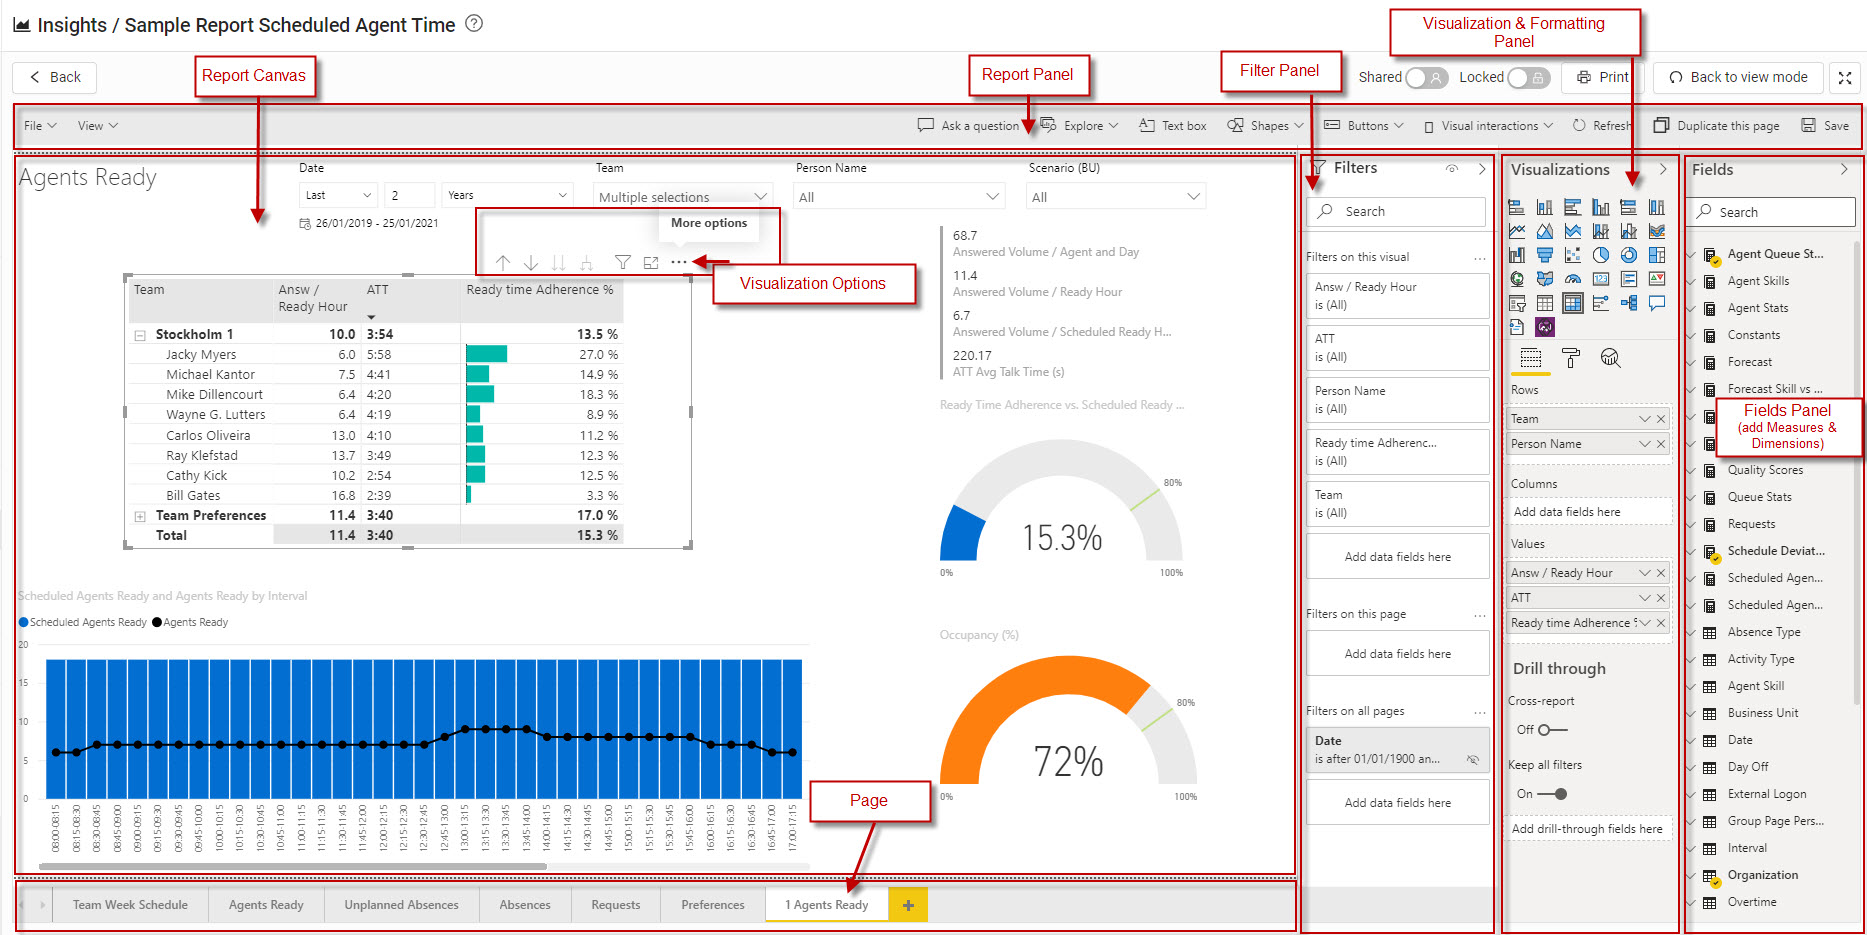
With permission to create or edit reports, you can work with a report in the edit mode. A report can have several pages, much like worksheets in Microsoft Excel. Each page has a report canvas where you can add several visualizations. To control the report canvas area there are three panels; Visualizations, Fields and Filters. You can show or hide the control panels as you prefer when working with a report.
- In the Visualizations panel you select the type of visualization and filter and format the visualization. You can add several visualizations to the same page. Each visualization has additional options depending on the selected type of visualization.
- In the Fields panel you select the measures and dimensions to add for each visualization.
- The Filters panel is used to filter the data in a visualization, on a page or in the report. It is available in both the edit mode and the view mode.
The picture below is an example of a report in the edit mode.
Related topics