

Using parameters in titles and descriptions in Insights
When you create parameters in Insights, you can use them in titles and descriptions throughout your charts and analyses to dynamically display parameter values.
You can use parameters in the following areas of your analysis:
-
Chart titles and subtitles
-
Axis titles
-
Legend titles
-
Parameter control titles
-
Sheet titles and descriptions
The following image shows a chart title that uses a parameter.

Use the following procedures to learn how to add parameters to areas throughout your analysis. For more information about parameters and how to create them, see Parameters.
Adding parameters to chart titles and subtitles
Use the following procedure to learn how to add parameters to chart titles and subtitles.
To add a parameter to a chart title or subtitle
-
Open the Format visual pane for the visual that you want to format.
-
In the Format visual pane, choose the Title tab.
-
Select Show title or Show subtitle. These options might already be selected.
-
Choose the three dots at the right of Edit title or Edit subtitle, and then choose a parameter from the list.
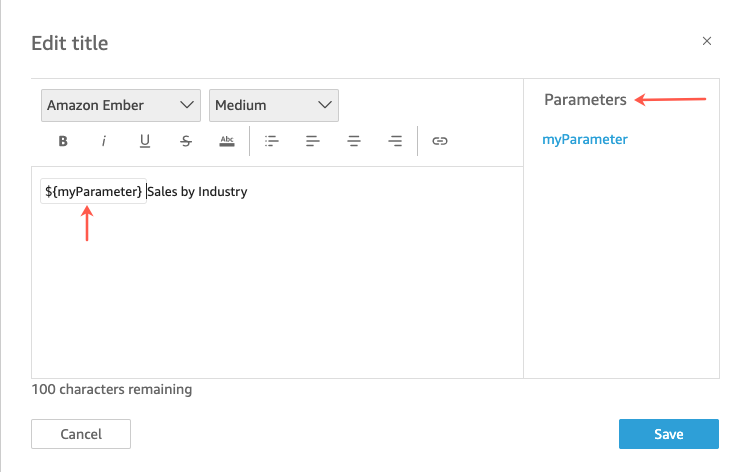
The parameter is added to the title in the Format visual pane. In the chart, the parameter value is displayed in the title.
For more information about editing titles and subtitles in visuals, see Format visual titles and subtitles in Insights.
Adding parameters to axis titles
Use the following procedure to learn how to add parameters to axis titles.
To add a parameter to an axis title
-
Open the Format visual pane for the visual that you want to format.
-
In the Format visual pane, choose the axis that you want to format.
-
Select Show title.
-
Choose the three dots at the right of the default axis title, and then choose a parameter from the list.
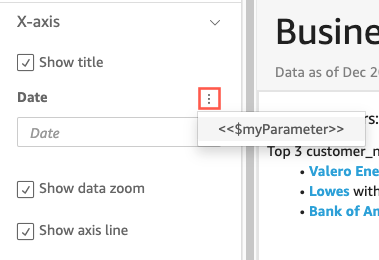
The parameter is added to the axis title in the Format visual pane. In the chart, the parameter value is displayed in the axis title.
For more information about editing axis titles, see Axes and grid lines.
Adding parameters to legend titles
Use the following procedure to learn how to add parameters to legend titles.
To add a parameter to a legend title
-
Open the Format visual pane for the visual that you want to format.
-
In the Format visual pane, choose Legend.
-
Select Show legend title.
-
Choose the three dots at the right of Legend title, and then choose a parameter from the list.
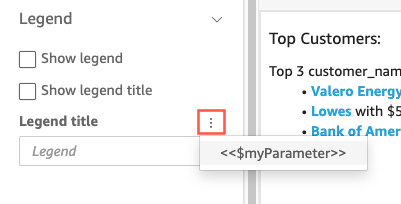
The parameter is added to the legend title in the Format visual pane. In the chart, the parameter value is displayed in the legend title.
For more information about formatting legends, see Legends on visual types in Insights.
Adding parameters to control titles
Use the following procedure to learn how to add parameters to parameter control titles.
To add a parameter to a parameter control title
-
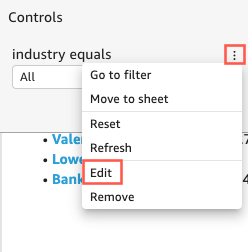
Select the parameter control that you want to edit, choose the three dots at the right of the parameter control title, and then choose Edit.
-
In the Edit control page that opens, select Show title.
-
Choose the three dots at the right of Display name, and then choose a parameter from the list.

The parameter is added to the parameter control title.
For more information about using parameter controls, see Parameter controls.
Adding parameters to sheet titles and descriptions
Use the following procedure to learn how to add parameters to sheet titles and descriptions in your analysis.
To add a parameter to a sheet title or description
-
On the analysis page, choose Add in the application bar and then choose Add title or Add description.
A sheet title or description appears on the sheet.
-
For Sheet title or for Description, choose the three dots at right, and then choose a parameter from the list.
The parameter is added to the sheet title or description and the parameter value appears in the text when you close the text box.
For more information about adding sheet titles and descriptions, see Adding a title and description to an analysis.