

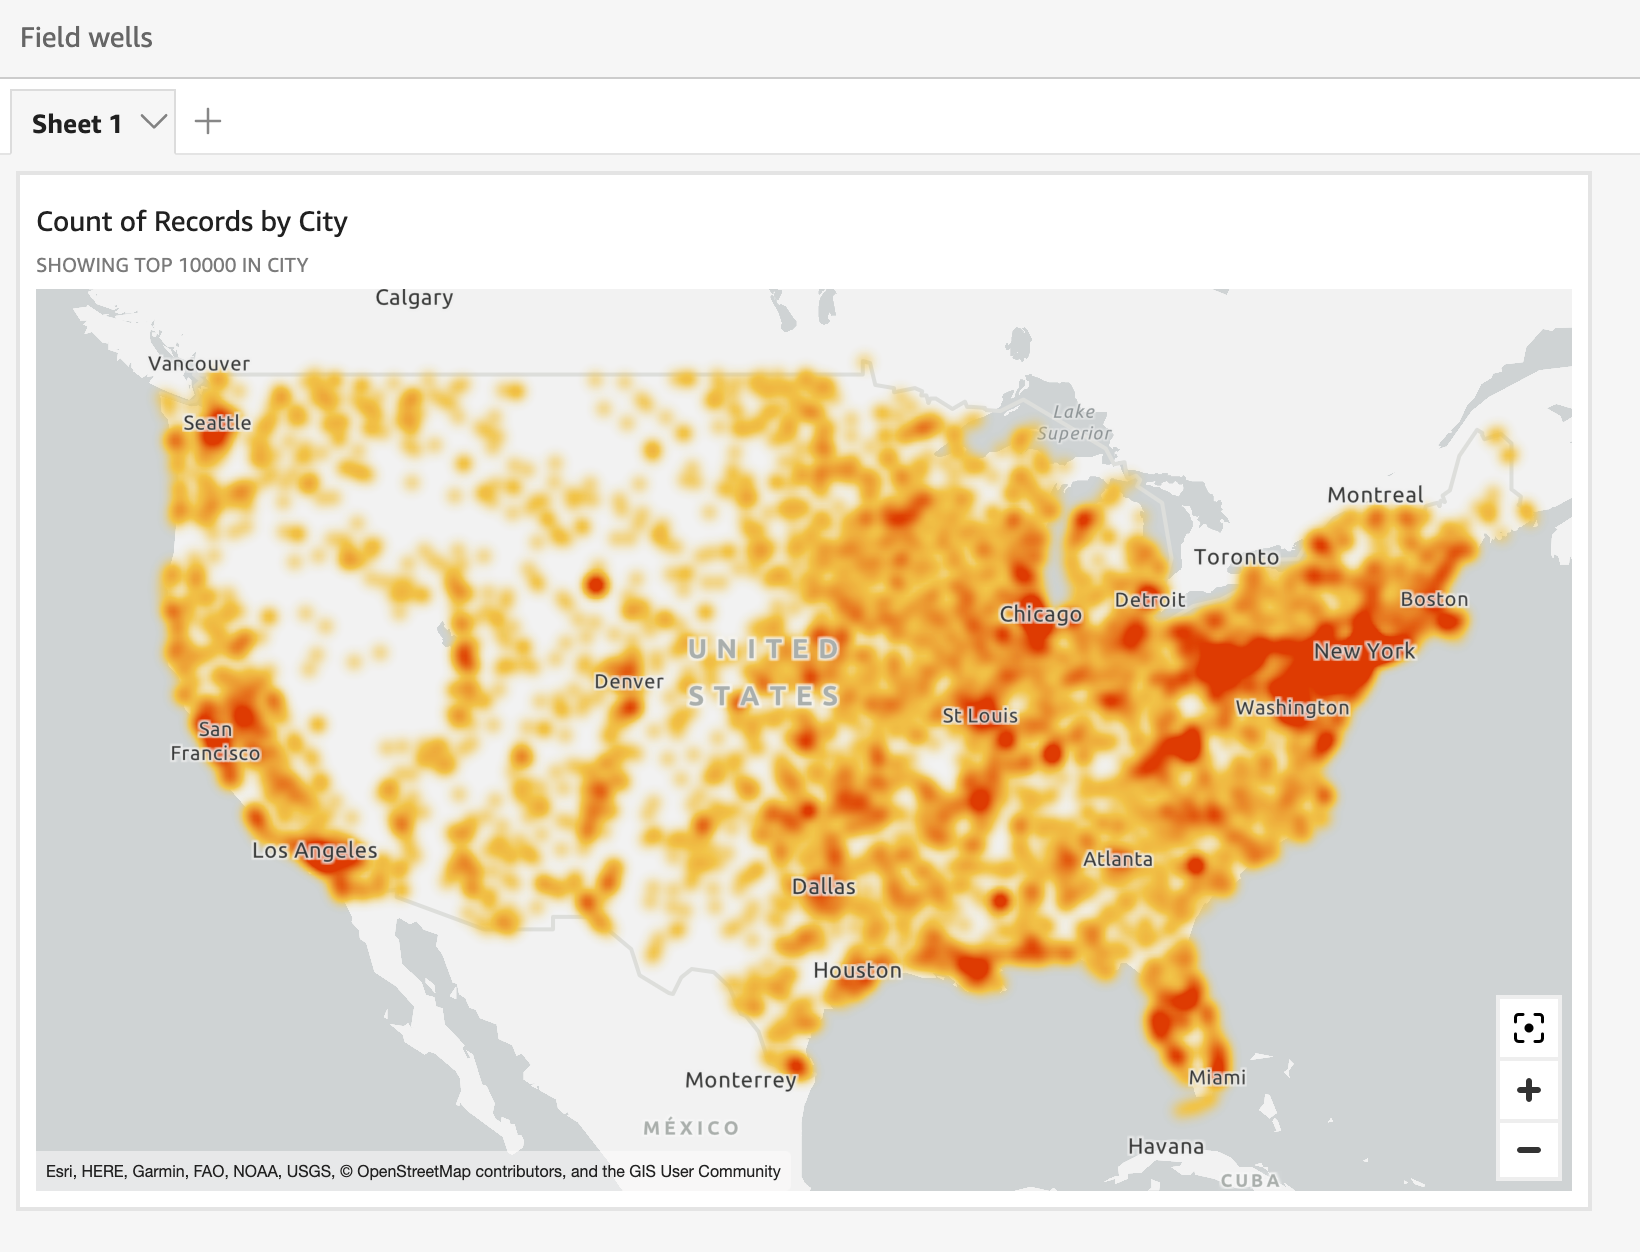
Create a heatmap in Insights
Use heatmaps to reveal patterns of marker concentration in your point maps. Heat maps display concentrations of data points using a colored overlay that highlights the intensity or concentration of the visual's markers.
Prerequisites
-
You have the Insights Author license.
- You have created a point map. See Create point maps for instructions.
Page location
Insights > Analyses > Click an analysis > Click a map
Procedure
Turn a point map into a heat map
- Click the Format visual icon on the upper-right corner of the map. The Properties panel opens.
- Expand Points.
- Select Heatmap.
- (Optional) To change the colors, click the blue squares next to High density and Low density and select a color.
Related topics