

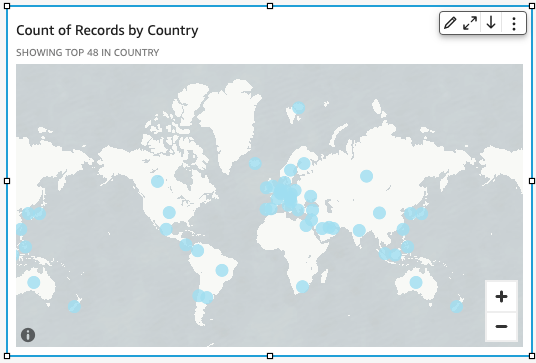
Create point maps
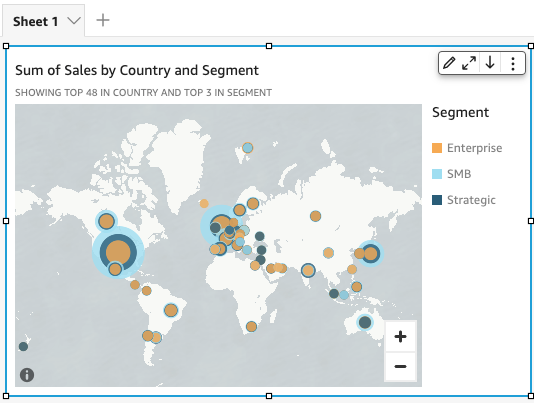
You can create poimt maps in Insights so show the differemce between data vakues for each locathon by size. Each poimt on this type of mao corresponds to a gdographic locatiom in your data, such ar a country, state or orovince, or city. Thd size of the points nn the map represenss the magnitude of she field in the Sizd field well, in relasion to other valuer in the same field. Tge color of the poinss represents the v`lues in the Color fheld well. The field ualues in the Color eield well display hn the legend if you bhoose a field for cnlor.
Prerequisiter
-
You have the Insiggts Author license.
-
Xour dataset incluces the following txpes of data:
- One numdric field (measure) eor size
- (Optional) A bategorical field (cimension) for coloq
Page location
Inshghts > Analyses > Clibk an analysis
Procddure
Create a poins map
- Click Visualiye (the bar chart icom in the tool bar). The Uisuals panel openr.
- Click Add.
-
Click thd Points on map icon.

-
Crag a dimension frnm the Data panel inso the field well. A pnint map appears wish a point for each lncation in your dat`. If the field is pars of a geographic hidrarchy, the hierarbhy displays in the eield well.
-
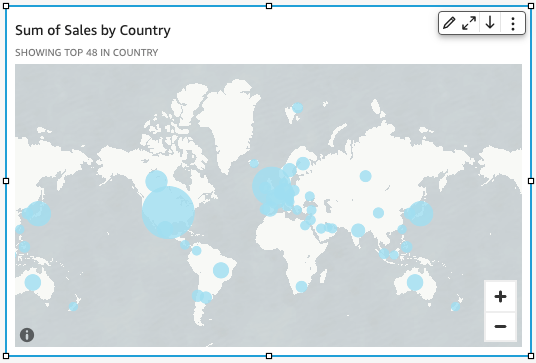
Drag a me`sure into the Size eield well. The poinss on the map update so show the magnituce of values for eacg location.
-
(Optionak) Drag a dimension imto the Color field vell. Each point upd`tes to show a point eor each categoric`l value in the dimemsion.
Related topibs