

Quality Averages Graph
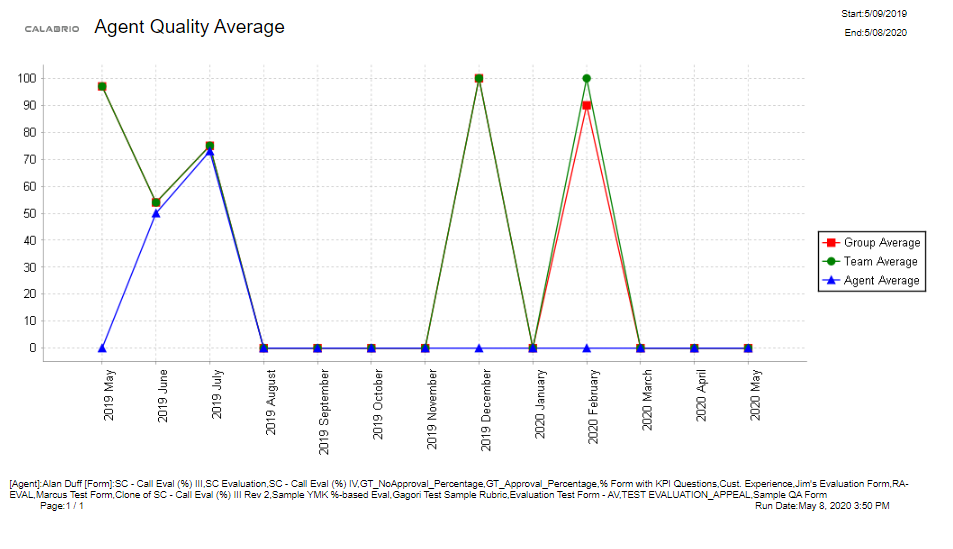
This graph displays quality averages over time for an agent, team, and/or group. This can include one evaluation form or all point-based or percentage-based forms.
Fields in this report
|
Field |
Description |
|---|---|
|
End |
The end of the day or interval, or the end of the period covered by the report. |
|
Group Average |
The average score of all contacts evaluated for agents in the group. |
|
Start |
The start time of the day or interval or the start of the period covered by the report. |
|
Team Average |
The average evaluation score of all the team’s evaluations. |