

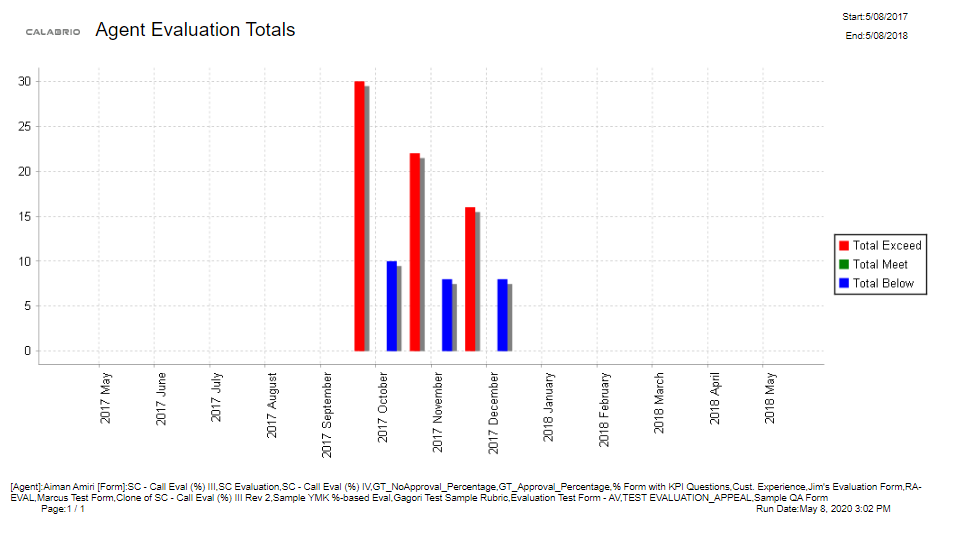
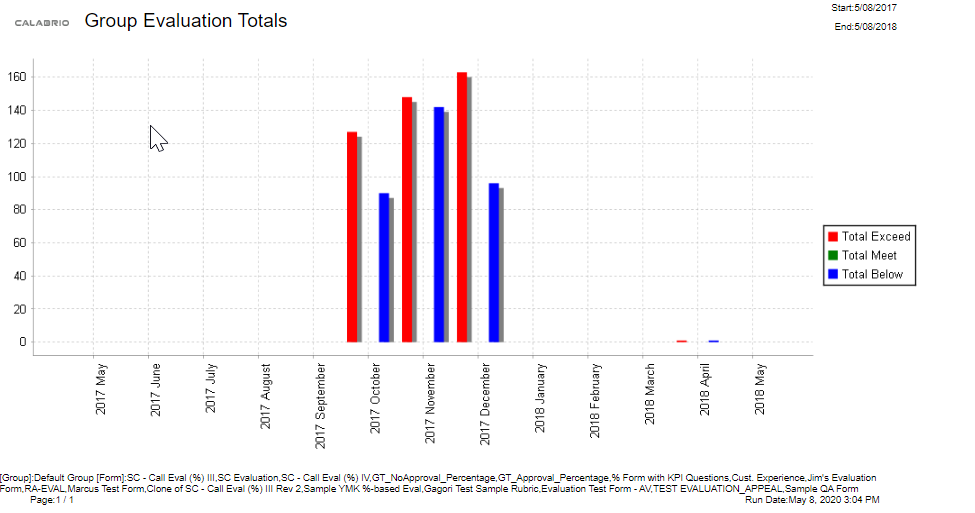
Evaluation Totals Graph
The Evaluation Totals Graph report displays the evaluation totals by month for an individual agent, group, or team.
Fields in this report
|
Field |
Description |
|---|---|
|
End |
The end of the day or interval, or the end of the period covered by the report. |
|
Start |
The start time of the day or interval or the start of the period covered by the report. |
|
Total Below |
The total number of evaluated contacts whose scores fall below expectations. The default score range is 0–74 percent. The range can be modified by the administrator. |
|
Total Exceed |
The total number of evaluated contacts whose scores exceed expectations. The default score range is 90–100 percent. This range can be modified by the administrator. |