

Ways to apply pivot table calculations
You can apply table calculations in the ways described following. Table calculations apply to only one field at a time. Thus, if you have a pivot table with multiple values, calculations are only applied to the cells representing the field that you applied the calculation to.
Prerequisites
-
You have the Insights Author license.
- You have created a pivot table in Insights (see Create a pivot table for instructions).
BEST PRACTICE For optimal performance and responsiveness, use regular tables instead of pivot tables whenever possible. Reserve pivot tables only for cases where their advanced features are specifically required.
Page location
Insights > Analyses > Click an analysis > Click a pivot table
Table across
Using Table across applies the calculation across the rows of the pivot table, regardless of any grouping. This application is the default.
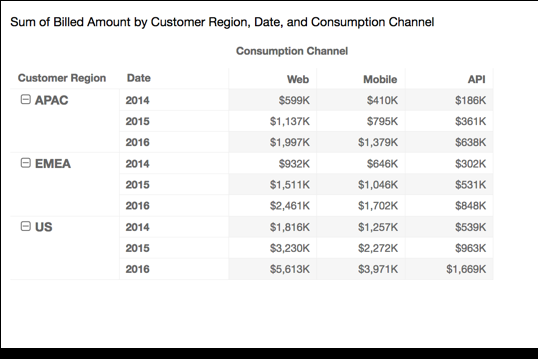
Take the following pivot table:

Applying the Running total function using Table across gives you the following results, with row totals in the last column:
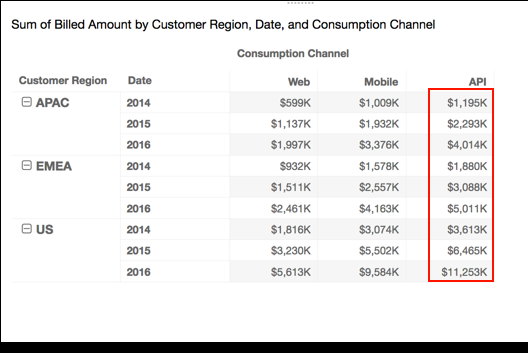
Table down
Using Table down applies the calculation down the columns of the pivot table, regardless of any grouping.
Take the following pivot table:

Applying the Running total function using Table down gives you the following results, with column totals in the last row:
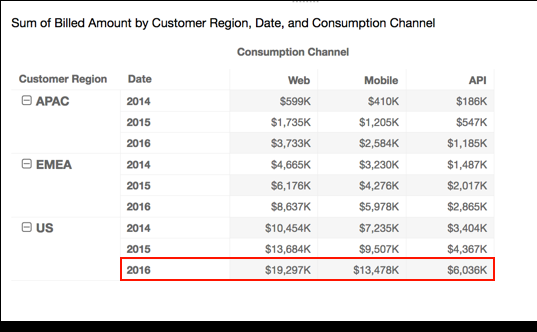
Table across down
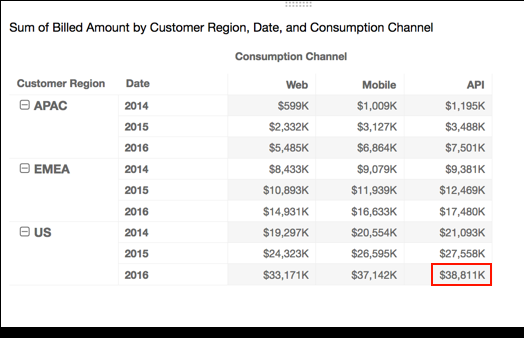
Using Table across down applies the calculation across the rows of the pivot table and then takes the results and reapplies the calculation down the columns of the pivot table.
Take the following pivot table:

Applying the Running total function using Table across down gives you the following results. In this case, totals are summed both down and across, with the grand total in the lower-right cell.
You can also apply the Rank function using Table across down. Doing so means that the initial ranks are determined across the table rows and then those ranks are in turn ranked down the columns. This approach gives you the following results:
![]()
Table down across
Using Table down across applies the calculation down the columns of the pivot table. It then takes the results and reapplies the calculation across the rows of the pivot table.
Take the following pivot table:

You can apply the Running total function using Table down across to get the following results. In this case, totals are summed both down and across, with the grand total in the lower-right cell.

You can apply the Rank function using Table down across to get the following results. In this case, the initial ranks are determined down the table columns. Then those ranks are in turn ranked across the rows.
![]()
Group across
Using Group across applies the calculation across the rows of the pivot table within group boundaries, as determined by the second level of grouping applied to the columns.
EXAMPLE If you group by field-2 and then by field-1, grouping is applied at the field-2 level. If you group by field-3, field-2, and field-1, grouping is again applied at the field-2 level. When there is no grouping, Group across returns the same results as Table across.
Take the following pivot table where columns are grouped by Service Line and then by Consumption Channel.
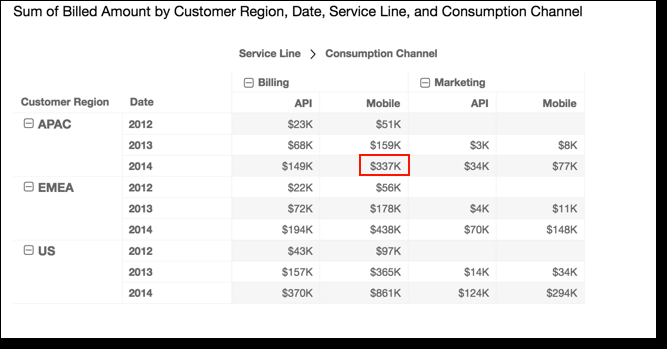
You can apply the Running total function using Group across to get the following results. In this case, the function is applied across the rows, bounded by the columns for each service category group. The Mobile columns display the total for both Consumption Channel values for the given Service Line, for the Customer Region and Date (year) represented by the given row. For example, the highlighted cell represents the total for the APAC region for 2012, for all Consumption Channel values in the Service Line named Billing.

Group down
Using Group down applies the calculation down the columns of the pivot table within group boundaries, as determined by the second level of grouping applied to the rows.
EXAMPLE If you group by field-2 and then by field-1, grouping is applied at the field-2 level. If you group by field-3, field-2, and field-1, grouping is again applied at the field-2 level. When there is no grouping, Group down returns the same results as Table down.
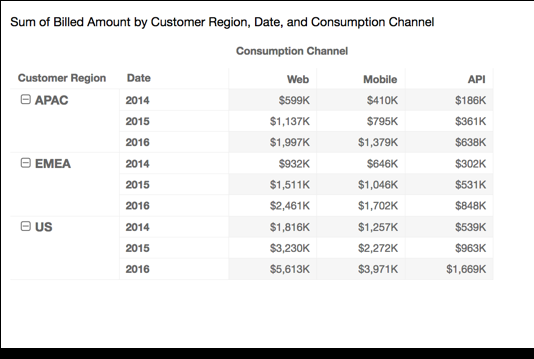
Take the following pivot table where rows are grouped by Customer Region and then by Date (year).

You can apply the Running total function using Group down to get the following results. In this case, the function is applied down the columns, bounded by the rows for each Customer Region group. The 2014 rows display the total for all years for the given Customer Region, for the Service Line and Consumption Channel represented by the given column. For example, the highlighted cell represents the total the APAC region, for the Billing service for the Mobile channel, for all the Date values (years) that display in the report.
Group across down
Using Group across down applies the calculation across the rows within group boundaries, as determined by the second level of grouping applied to the columns. Then the function takes the results and reapplies the calculation down the columns of the pivot table. It does so within group boundaries as determined by the second level of grouping applied to the rows.
EXAMPLE If you group a row or column by field-2 and then by field-1, grouping is applied at the field-2 level. If you group by field-3, field-2, and field-1, grouping is again applied at the field-2 level. When there is no grouping, Group across down returns the same results as Table across down.
Take the following pivot table where columns are grouped by Service Line and then by Consumption Channel. Rows are grouped by Customer Region and then by Date (year).
You can apply the Running total function using Group across down to get the following results. In this case, totals are summed both down and across within the group boundaries. Here, these boundaries are Service Line for the columns and Customer Region for the rows. The grand total appears in the lower-right cell for the group.
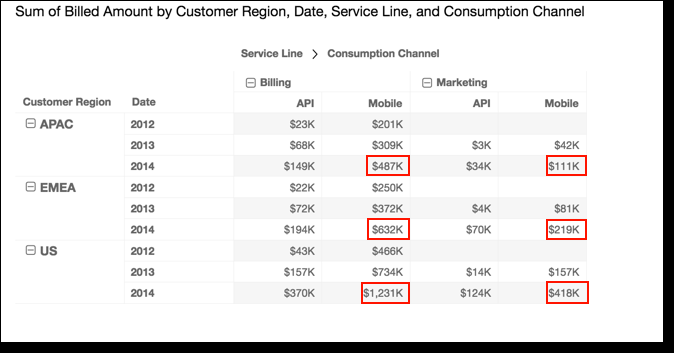
You can apply the Rank function using Group across down to get the following results. In this case, the function is first applied across the rows bounded by each Service Line group. The function is then applied again to the results of that first calculation, this time applied down the columns bounded by each Customer Region group.
![]()
Group down across
Using Group down across applies a calculation down the columns within group boundaries, as determined by the second level of grouping applied to the rows. Then Insights takes the results and reapplies the calculation across the rows of the pivot table. Again, it reapplies the calculation within group boundaries as determined by the second level of grouping applied to the columns.
EXAMPLE If you group a row or column by field-2 and then by field-1, grouping is applied at the field-2 level. If you group by field-3, field-2, and field-1, grouping is again applied at the field-2 level. When there is no grouping, Group down across returns the same results as Table down across.
For example, take the following pivot table. Columns are grouped by Service Line and then by Consumption Channel. Rows are grouped by Customer Region and then by Date (year).

You can apply the Running total function using Group down across to get the following results. In this case, totals are summed both down and across within the group boundaries. In this case, these are Service Category for the columns and Customer Region for the rows. The grand total is in the lower-right cell for the group.

You can apply the Rank function using Group down across to get the following results. In this case, the function is first applied down the columns bounded by each Customer Region group. The function is then applied again to the results of that first calculation, this time applied across the rows bounded by each Service Line group.
![]()
Related topics