

Show and hide pivot table columns in Insights
By default, all columns, rows, and their field values appear when you create a pivot table. If you hide fields and publish the pivot table as part of a dashboard, anyone who subscribes to the dashboard can export the pivot table to a comma-separated value (CSV) or Microsoft Excel file. They can choose to export only the visible fields or all fields. For more information, see the “Exporting data from a dashboard to a CSV” section in Export and print interactive dashboard reports.
Prerequisites
-
You have the Insights Author license.
- You have created a pivot table in Insights (see Create a pivot table for instructions).
BEST PRACTICE For optimal performance and responsiveness, use regular tables instead of pivot tables whenever possible. Reserve pivot tables only for cases where their advanced features are specifically required.
Page location
Insights > Analyses > Click an analysis > Click the pivot table
Procedures
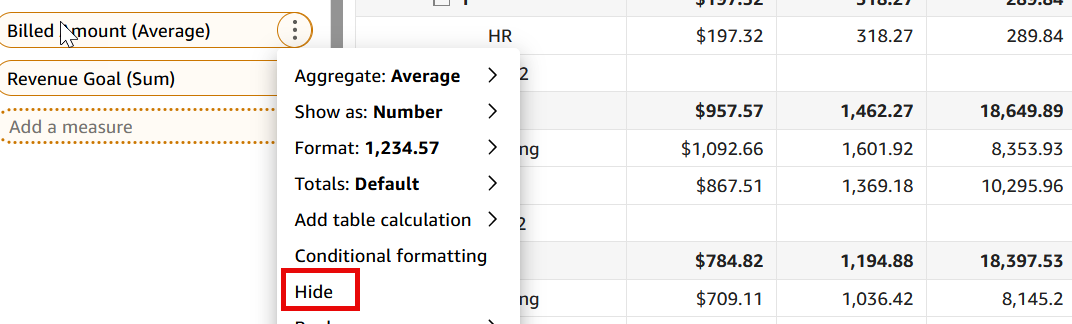
Hide a column or row in a pivot table
You can hide columns and rows that you don't want to appear in the pivot table without changing the pivot table values. If you have more than one measure in the pivot table, you can also hide values.
-
Click the three dots for the field in the Rows, Columns, or Values field wells, and then select Hide.
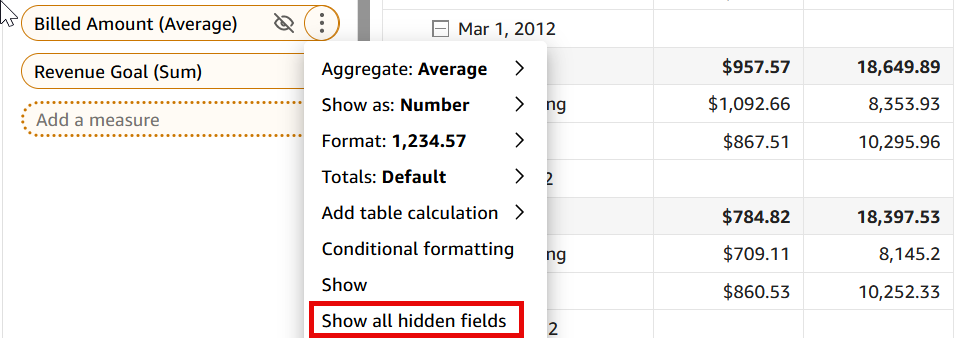
Show a hidden field in a pivot table
- Click the three dots for the field in the Rows, Columns, or Values field well, and then select Show.
Show all hidden fields in a pivot table
-
Click the three dots next to any field in the Rows, Columns, or Values field well, and then select Show all hidden fields.
Related topics