windowAvg
The windowAvg function calculates the average of the aggregated measure in a custom window that is partitioned and sorted by specified attributes. Usually, you use custom window functions on a time series, where your visual shows a metric and a date field. For example, you can use windowAvg to calculate a moving average, which is often used to smooth out the noise in a line chart.
Window functions aren't supported for MySQL versions earlier than 8 and MariaDB versions earlier than 10.2.
Syntax
The brackets are required. To see which arguments are optional, see the following descriptions.
windowAvg
    (
         measure
            , [sort_order_field ASC/DESC, ...]
            , start_index
            , end_index
         ,[ partition_field, ... ]
    )
Arguments
measure
The aggregated metric that you want to get the average for, for example sum({Revenue}).
sort attribute
One or more aggregated fields, either measures or dimensions or both, that you want to sort the data by, separated by commas. You can either specify ascending (ASC) or descending (DESC) sort order.
Each field in the list is enclosed in { } (curly braces), if it's more than one word. The entire list is enclosed in [ ] (square brackets).
start index
The start index is a positive integer, indicating n rows above the current row. The start index counts the available data points above the current row, rather than counting actual time periods. If your data is sparse (missing months or years, for example), adjust the indexes accordingly.
end index
The end index is a positive integer, indicating n rows below the current row. The end index counts the available data points below the current row, rather than counting actual time periods. If your data is sparse (missing months or years, for example), adjust the indexes accordingly.
partition field
(Optional) One or more dimensions that you want to partition by, separated by commas.
Each field in the list is enclosed in {} (curly braces), if it's more than one word. The entire list is enclosed in [ ] (square brackets).
Example
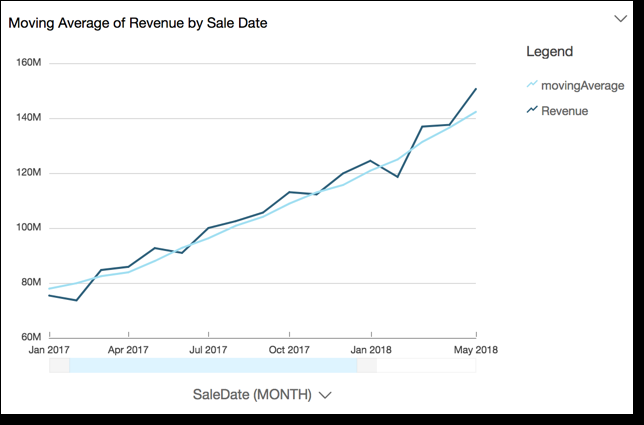
The following example calculates the moving average of sum(Revenue), partitioned by SaleDate. The calculation includes three rows above and two row below of the current row.
windowAvg
    (
         sum(Revenue),
         [SaleDate ASC],
         3,
            2
    )
The following screenshot shows the results of this moving average example. The sum(Revenue) field is added to the chart to show the difference between the revenue and the moving average of revenue.


