

Copy and edit a pre-built report
As a result of your exploration, you’ve found a report that you like. A good way to dip your toe into reports is to copy a report that already exists and edit it.
NOTE We designed each pre-built report specifically to be part of the pre-built dashboard it lives in. To use a pre-built report outside of its pre-built dashboard, you might need to adjust its settings.
- On the Data Explorer page, right-click a report and select Copy.
-
Select Owned by Me from the drop-down list in the upper left corner of the page. Reports that you copied appear in the list with “copy” at the end of their names.
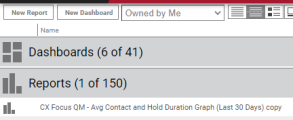
- Click the report to open it.

Now it’s playtime! Don’t worry, you won’t break anything. If you make a change that you like, click Save. If you make a change that you don’t like, click Revert to Saved to return the report to its last saved state. If you mess the report up beyond recognition, just copy the original again and start over.
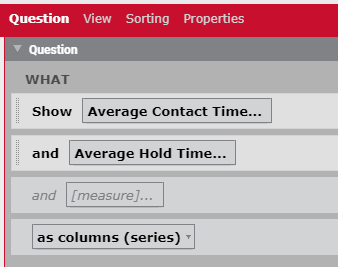
Question: WHAT (measures)
The WHAT section of the Question panel lists the basic information (or “measure”) that the report displays. Measures are usually numbers. Reports must have at least one measure and can have multiple measures. Example measures include:
- The amount of time that agents spent using a specific program or application
- Contact duration in seconds
- The number of comments on an evaluation
Activities for measures
Try these activities to get a sense of how measures work. Observe how each action affects the report.
- Click [measure] and add another measure to the report.
- Click a measure to open it and then click By Tags. Click each tag in the Tags panel, and note which tag(s) this measure has.
- Click a measure to open it and then click Remove to remove it from the report.
- Reorder the measures by clicking and dragging them.
- For time-based measures, select ATTR_DURATION from the <no attribute field> drop-down list.
-
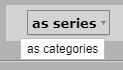
Select something different from the as drop-down list.

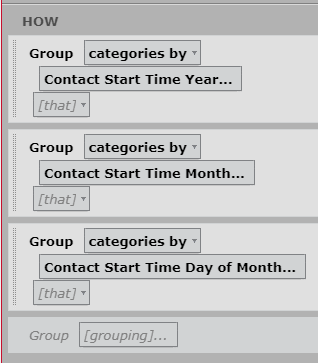
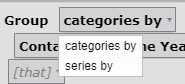
Question: HOW (groupings)
The HOW section of the Question panel specifies how the measure numbers are organized (or “grouped”). Common groupings organize measure data by person (like agent or evaluator) or date (like when a contact happened or when it was evaluated). Reports do not technically require groupings, but most reports need them in order to make the measure meaningful. Reports can have multiple groupings.
Activities for groupings
Try these activities to get a sense of how groupings work. Observe how each change affects the report.
- If the report has more than one grouping, reorder the groupings by clicking and dragging them.
-
Select something different from the by drop-down list.
- Click one of the groupings and change it to something else.
- Click a grouping to open it and click Remove to remove it from the report.
- Click [grouping] and add another grouping to the report.
- Click [that] underneath one of the groupings and add a measure that narrows the grouping further.

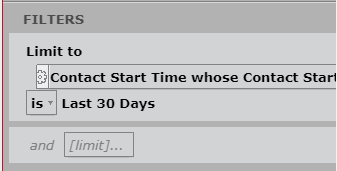
Question: FILTERS (limits)
The FILTERS section of the Question panel limits the data in the report. A report without any filters would show all the measure data for all time since your organization started using Calabrio ONE. Common filters are time (like limiting data to the last thirty days) and people (like limiting data to the Blue team). Like groupings, filters are not technically required, but most reports have at least one filter.
Activities for filters
Try these activities to get a sense of how filters work. Observe how each change affects the report.
- Select something else from the is drop-down list.
- Click the filter and change it to something else. Use the Subject | Time toggle to move between different types of filters.
- Click [limit] and add another filter to the report.
- For a report with multiple filters, select or from the and drop-down list.
View
By default, reports appear as basic tables. The View panel lets you change how the report appears (like showing the data as a line graph or a word cloud), adjust the colors and fonts, and more.
Activities for views
Try these activities to get a sense of how the View settings work. Observe how each change affects the report.
- Click a different View Type to change the report’s layout.
- Play around with the font and colors in the Styling section.
- Change the report’s title in the Titles section.
- Experiment with the other View settings as much as you like.