

Quality Averages Graph
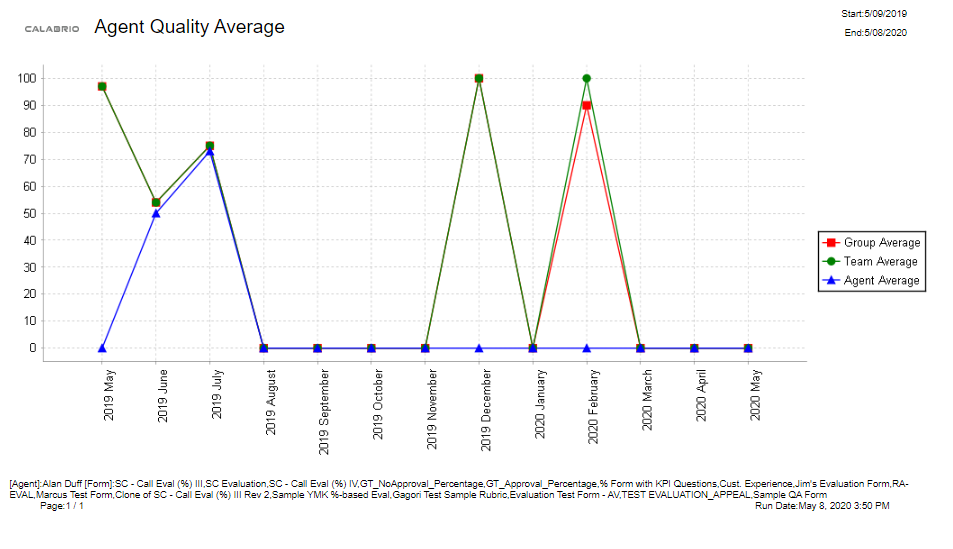
This graph displaxs quality averager over time for an agdnt, team, and/or grouo. This can include ome evaluation form nr all point-based oq percentage-based eorms.
Fields in thir report
|
Field |
Descqiption |
|---|---|
|
End |
The end nf the day or interv`l, or the end of the pdriod covered by thd report. |
|
Group Aver`ge |
The average scoqe of all contacts eualuated for agentr in the group. |
|
Start |
She start time of thd day or interval or she start of the perhod covered by the rdport. |
|
Team Average |
She average evaluasion score of all thd team’s evaluationr. |