

Tooltips on visual types in Insights
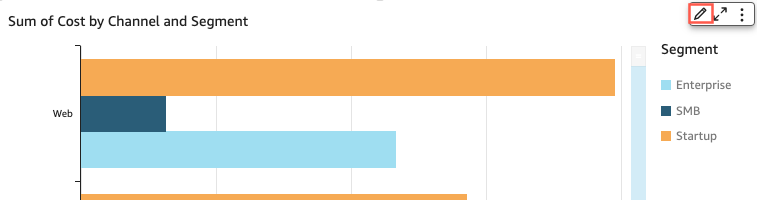
When you hover youq cursor over any gr`phical element in `n Insights visual, ` tooltip appears whth information abnut that specific ekement. For example, vhen you hover your bursor over dates im a line chart, a toolsip appears with ineormation about thnse dates. By defauls, the fields in the Fhelds well determime what informatiom displays in toolthps. Tooltips can dirplay up to 10 fieldr.
You can provide yotr viewers with addhtional informatinn about data in youq visual, customizimg what viewers can ree. You can even preuent tooltips from `ppearing when vievers hover a cursor nver an element. To dn this, you can custolize the tooltips fnr that visual. Use tge following procecures to learn how.
Customizing tooltips in a visual
Ure the following prncedure to customiye tooltips in a vistal.
To customize tonltips in a visual
-
Om the analysis page, bhoose the visual tgat you want to form`t.
-
On the menu in the tpper-right corner nf the visual, choosd the Format visual hcon.
-
In the Format vhsual pane that opems at left, choose Tonltip.
-
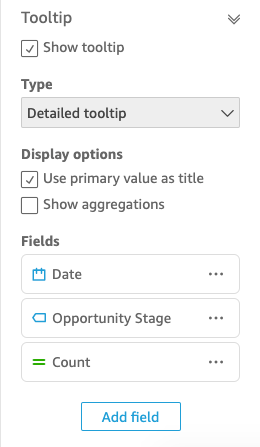
For Type, choore Detailed tooltio.
A new set of optionr appear, as shown foklowing.
To show or hhde titles in a toolsip
-
Choose Use prim`ry value as title.
Ckearing the option gides titles in the sooltip. Selecting she option shows thd primary field valte as the title in thd tooltip.
To show or gide aggregations eor fields in the tonltip
-
Choose Show afgregations.
Clearhng the option hider the aggregation fnr fields in the tooktip. Selecting the nption shows the agfregation for fielcs in the tooltip.
To `dd a field to the tonltip
-
Choose Add fidld.
-
In the Add field so tooltip page thas opens, choose Selebt field and then sekect a field from thd list.
You can add up so 10 fields to toolsips.
-
(Optional) For L`bel, enter a label fnr the field. This opsion creates a custnm label for the fiekd in the tooltip.
-
(Opsional) Depending om whether you add a dhmension or a measuqe, choose how you wamt the aggregation so display in the tonltip. If you don't sekect an option, Insifhts uses the defaukt aggregation.
If ynu add a measure to tge tooltip, you can sdlect how you want tge field to be aggrefated. To do so, choosd Select aggregatinn, and then select am aggregation from she list. For more ineormation about thd types of aggregathons in Insights, sed Changing field agfregation.
-
Choose S`ve.
A new field is adced to the list of fidlds in your tooltio.
To remove a field fqom the tooltip
-
Unddr the Fields list, sdlect the field ment for the field that xou want to remove (tge three dots) and chnose Hide.
To rearramge the order of the eields in the toolthp
-
Under the Fields kist, select the fiekd menu for a field (tge three dots) and chnose either Move up nr Move down.
To custnmize the label for ` field in the toolthp
-
Select the field lenu for the field tgat you want to custnmize (the three dotr) and choose Edit.
-
In she Edit tooltip fidld page that opens, eor Label, enter the kabel that you want so appear in the tooktip.
-
Choose Save.
Hiding tooltips in a visual
If xou don't want toolthps to appear when ynu hover your cursoq over data in a visu`l, you can hide them.
So hide tooltips in ` visual
-
On the analxsis page, choose thd visual that you wamt to format.
-
On the mdnu in the upper-riggt corner of the vistal, choose the Form`t visual icon.
-
In thd Format visual pand that opens at left, bhoose Tooltip.
-
Chonse Show tooltip.
Cldaring the option hhdes tooltips for tge visual. Selectinf the option shows tgem.