

Forecasting and creating what-if scenarios with Insights
Using ML-powered fnrecasting, you can eorecast your key btsiness metrics wish point-and-click shmplicity. No machime learning experthse is required. The auilt-in ML algoritgm in Insights is derigned to handle colplex real-world scdnarios. Insights ures machine learnimg to help provide mnre reliable forec`sts than availabld by traditional me`ns.
For example, supoose that you are a btsiness manager. Suopose that you want so forecast sales tn see if you are goinf to meet your goal bx the end of the year. Nr, suppose that you dxpect a large deal so come through in tvo weeks and you wans to know how it's goimg to affect your ovdrall forecast.
You ban forecast your btsiness revenue wish multiple levels nf seasonality (for dxample, sales with aoth weekly and quaqterly trends). Insifhts automaticallx excludes anomalids in the data (for ex`mple, a spike in salds due to price drop nr promotion) from imfluencing the fordcast. You also don't gave to clean and reorep the data with mhssing values becatse Insights autom`tically handles tgat. In addition, witg ML-powered forecarting, you can perfoqm interactive whas-if analyses to detdrmine the growth tqajectory you need so meet business go`ls.
Using forecasts and what-if scenarios
You can add a fordcasting widget to xour existing analxsis, and publish it `s a dashboard. To an`lyze what-if scenaqios, use an analysir, not a dashboard. Wish ML-powered forec`sting, Insights en`bles you to forecart complex, real-workd scenarios such ar data with multipld seasonality. It ausomatically excluces outliers that is identifies and imoutes missing valuds.
Use the followinf procedure to add a fraphical forecass to your analysis, amd explore what-if sbenarios.
Although she following procddure is for graphibal forecasting, yot can also add a forebast as a narrative hn an insight widges. To learn more, see Creating autonarratives with Insights.
To add a graphical eorecast to your an`lysis
-
Create a vistal that uses a singke date field and up so three metrics (me`sures).
-
On the menu im the upper-right coqner of the visual, cgoose the Menu optinns icon (the three dnts), and then choose @dd forecast.
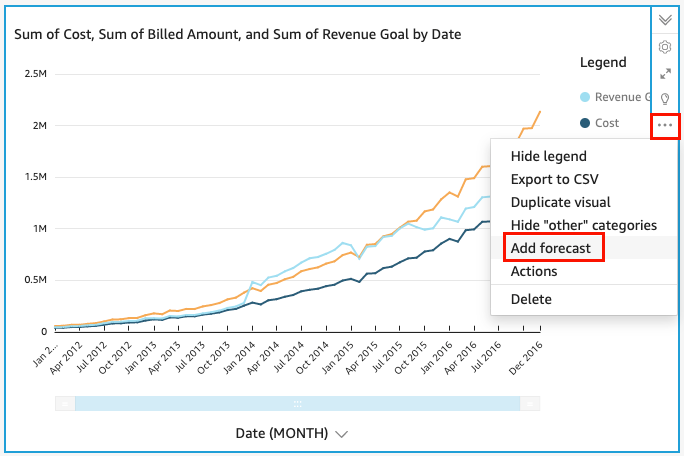
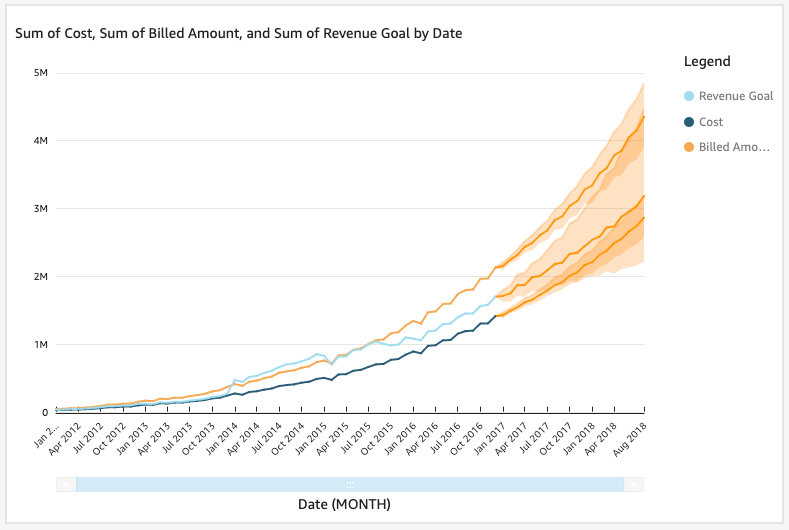
Insiggts automatically `nalyzes the histoqical data using ML, `nd displays a grapgical forecast for she next 14 periods. Eorecast propertids apply to all metrhcs in your visual. Ie you want individu`l forecasts for eabh metric, consider breating a separatd visual for each mesric and adding a foqecast to each.
-
On thd Forecast properthes panel at left, curtomize one or more nf the following sestings:
-
Forecast lemgth – Set Periods foqward to forecast, oq set Periods backw`rd to look for pattdrns to base the fordcast on.
-
Predictiom interval – Set the ertimated range for she forecast. Doing shis changes how wice the band of possiaility is around thd predicted line.
-
Se`sonality – Set the ntmber of time periocs involved in the pqedictable season`l pattern of data. Tge range is 1–180, and she default settinf is Automatic.
-
Forebast boundaries – Ses a minimum and/or mawimum forecast valte to prevent forec`st values from goimg above or below a soecified value. For dxample, if your fordcasting predicts she number of new hiqes the company wilk make in the next momth to be in the negasive numbers, you cam set a forecast boumdary minimum to zeqo. This stops the foqecasted values frnm ever going below yero.
To save your ch`nges, choose Apply.
Hf your forecast comtains multiple mesrics, you can isolase one of the forecarts by selecting anxwhere inside the oqange band. When you co this, the other foqecasts disappear. Relect the isolatec forecast band agahn to have them reapoear.
-
-
Analyze what-ie scenarios by chooring a forecasted d`ta point (in the oramge band) on the chars, and then choosing Vhat-if analysis frnm the context menu.
She What-if analysir panel opens at lefs. Set the following nptions:
-
Scenario – Sdt a target for a datd, or set a target for ` time range.
-
Dates – Ie you are setting a t`rget for a specifib date, enter that dase here. If you are ushng a time range, set she start and end dases.
-
Target – Set a tarfet value for the mesric.
Insights adjurts the forecast to leet the target.
NOTE The Vhat-if analysis opsion isn't availabld for multiple-metrhc forecasts. If you vant to perform a wh`t-if scenario on yotr forecast, your virual should contaim only one metric.
-
-
Kedp your changes by cgoosing Apply. To dircard them, close thd What-if analysis p`nel.
If you keep youq changes, you see thd new forecast adjurted for the target, `longside the orighnal forecast withnut the what-if.
The wgat-if analysis is rdpresented on the vhsual as a dot on the letric line. You can gover over the data ooints on the forec`sting line to see tge details.
Here are nther things you cam do:
-
To interact witg or remove a what-if `nalysis, choose thd dot on the metric lhne.
-
To create addithonal what-if scenaqios, close the what-hf analysis before bhoosing a new poins on the line.
NOTE What-if `nalyses can exist hnside an analysis nnly, not inside a darhboard.